
You are using an out of date browser. It may not display this or other websites correctly.
You should upgrade or use an alternative browser.
You should upgrade or use an alternative browser.
How would you trade this chart ?
- Thread starter tony.m
- Start date
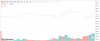
volume is the most fickle and dangerous indicator...first delete it.
it is a leading indicator but it does not lead by the same amount everytime and with the market habit of whipsawing you will enter too early which is ok for an holder but not for trader who wants fast money
second find another chart that is swinging.
just because there is a chart you find does not mean you trade it or that it is tradeable
it is a leading indicator but it does not lead by the same amount everytime and with the market habit of whipsawing you will enter too early which is ok for an holder but not for trader who wants fast money
second find another chart that is swinging.
just because there is a chart you find does not mean you trade it or that it is tradeable
Last edited:
Would you take any trades before 14:00 ?Volume comes in as making double bottom and expands as price rising. It in a buy for me.
I like to trade by price only, no lines/indicators or candles.just because there is a chart you find does not mean you trade it or that it is tradeable

That's right, it's trading in a range, so it would be easiest to trade S/R. But would you have known at the time this would turn out to be a chop zone??? (Those who say they do are in possession of special power or they're outright liars.)Most traders would use S/R to trade this chart.
Is there any other way to trade this ?
Another way to trade this is using trendlines. But then I ask, would you?? (Most traders here won't.)
I have backtested trendlines without much luck.Another way to trade this is using trendlines. But then I ask, would you?? (Most traders here won't.)
Looking to find something different than vodou TA lines or candle bar counting.
one other way is to take second entries
i do that all the time very high win rates if you scalp out in 5 min .....and a lot of trades but not suited for everyone
i do that all the time very high win rates if you scalp out in 5 min .....and a lot of trades but not suited for everyone
What I've divulged should be more than enough to get the ball rolling for you. But, intstead, you decide to go the beggar's route, asking for free advice. So I leave you with the following quote from Tao Te Ching.I have backtested trendlines without much luck.
Looking to find something different than vodou TA lines or candle bar counting.
"Those who know don't talk. Those who talk don't know."
S/R and trendlines ?What I've divulged should be more than enough to get the ball rolling for you.