Which ‘Expected Move’ Can Help Your Option Strategies? Standard, Binary, and Implied Moves: When to Use Each?
One of the most crucial yet often misunderstood concepts in options trading is the “Expected Move.” Despite its widespread use by top educators, I’ve noticed confusion among traders due to unclear distinctions between different types of Expected Move calculations. This post aims to demystify the key types of Expected Move used in options trading, explaining their applications, advantages, and limitations.
My goal is to help the options community better understand market dynamics and use strategies more effectively.
However, simply saying “Expected Move = 68%” is not enough; the calculation method you choose significantly impacts the precise range prediction.
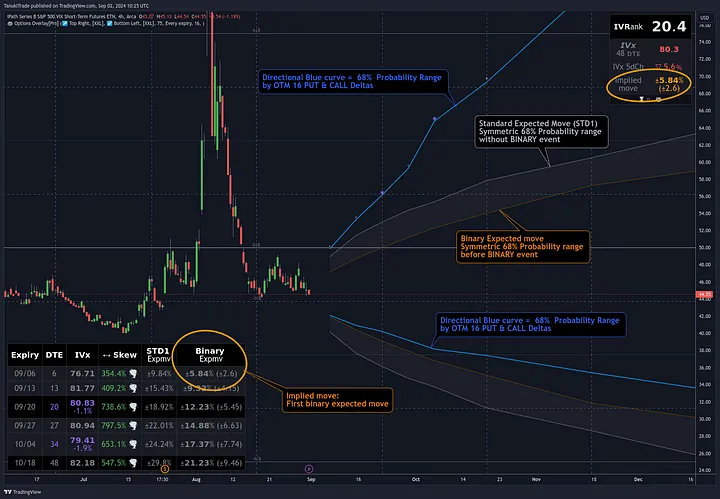
The difference could be huge, illustrated clearly on the $VXX TradingView chart above, where various types of Expected Move lines are automatically visualized.
Why Understanding Expected Move Matters in Options Trading
The Expected Move represents the price movement anticipated by the options market within a specific expiration period, indicating where a stock’s spot price will most likely land, with a 68% probability.
Understanding the Expected Move gives traders insights into how the market prices volatility, aiding strategic decisions around buying or selling positions. Different methods of calculating Expected Move cater to varying market conditions, each with unique characteristics.
Market Dynamics in Options: Volatility Equals Risk, Stability Equals Predictability
In options, we distinguish between symmetrical and directional Expected Moves, binary and standard moves, and even calculations based solely on options deltas. Let’s break down the major types of Expected Move and when to use them.
Before we dive in, make sure you understand the exact definition of a binary event.
A binary event is classified as an upcoming announcement with an uncertain outcome. These events do not catch the market off guard; they are anticipated and typically come with a level of volatility that reflects overall market uncertainty.
Examples include earnings reports, major political announcements, or significant Fed events.
Breaking Down Expected Move: What Every Options Trader Needs to Know
1. Standard Expected Move (STD1): The Calm Before the Storm
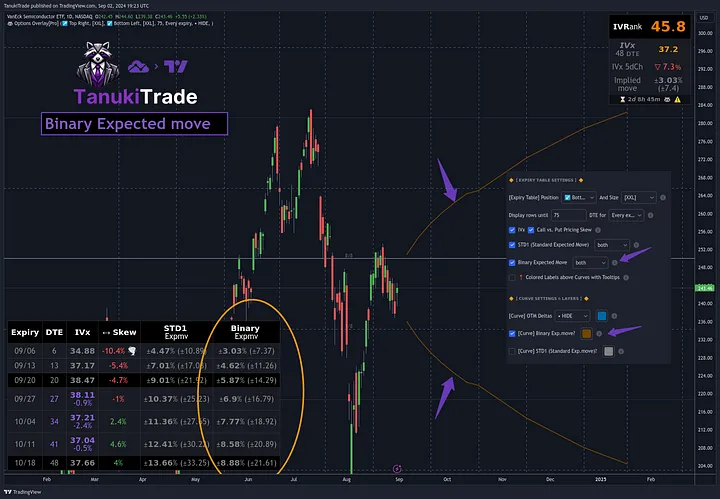
2. Binary Expected Move (BEM): Capturing Event-Driven Volatility
BEM is used when a binary event is expected, or when options are near expiration. In these scenarios, implied volatility — especially for near-term expirations — spikes, making standard calculations less accurate. Binary events might include earnings reports, major policy announcements, or significant Fed events. BEM focuses on the most volatile option prices near the At-The-Money (ATM) point.
BEM Calculation (the TastyTrade Method)
The Binary Expected Move is calculated using a weighted sum of the ATM straddle price and the prices of the first and second Out-Of-The-Money (OTM) strangles.
binary_expected_move = (atm_straddle_price * 0.6) + (first_otm_strangle_price * 0.3) + (second_otm_strangle_price * 0.1)
Characteristics
The Binary Expected Move suggests a narrower range than the Standard Expected Move, making it more precise in predicting expected market reactions in binary risk scenarios. Although symmetrical, it represents a tighter range, accurately reflecting the true 68% probability area because the Standard Expected Move can become skewed due to increased IV from binary risk, making realistic options around it harder to find.
In the chart below, the Binary Expected Move and range are shown in brown, corresponding to each expiration.
3. Implied Move: The Essential Metric Before Earnings
The Implied Move reflects the expected price range for the nearest expiration, particularly ahead of a known binary event like an earnings report. It often represents the anticipated market movement for the current week, helping traders optimize their positions. Basically this is the closest binary expected move.
Application: Implied Move is frequently used before earnings reports or other binary events, helping traders optimize their positions.
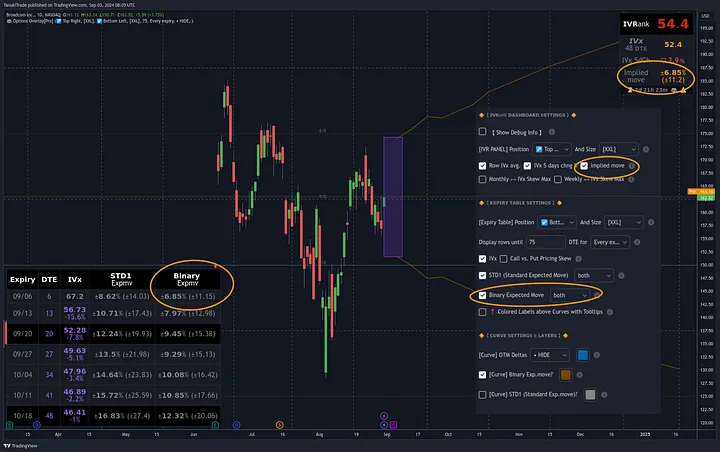
Example: For $AVGO, which has an earnings report on Thursday, the implied move is derived from the earliest expiration (09/06), suggesting a 68% chance that the price will remain within ±11.15 (±6.85%) after the report, based on current market pricing.
4. The Delta Neutral Probability Range (Directional Expected move)
Understanding and correctly applying Expected Moves is essential for options traders. The Standard Expected Move helps in stable market conditions, while Binary and Implied Moves are particularly useful before binary events, where drastic price changes are anticipated. The directional delta probability range allows traders to spot market distortions and fine-tune their options strategies accordingly.
Each type conveys different information, and knowing how to use them effectively enables traders to adapt their strategies to various market situations. It’s crucial to keep an eye on market changes and consciously apply these metrics in your trading decisions.
It might seem like a small detail, but consider this: it’s not the same to trade a breakout on the last chart with a CALENDAR or a credit BWB. One thing is sure: seeing this PUT-skew chart, I hope no one who truly understands options would buy a single-leg PUT if they want to trade downward — there’s always a better way.
Let’s trade smart and make informed decisions with options!
Gregory Peter Szilagyi,
Founder of TanukiTrade Options
One of the most crucial yet often misunderstood concepts in options trading is the “Expected Move.” Despite its widespread use by top educators, I’ve noticed confusion among traders due to unclear distinctions between different types of Expected Move calculations. This post aims to demystify the key types of Expected Move used in options trading, explaining their applications, advantages, and limitations.
My goal is to help the options community better understand market dynamics and use strategies more effectively.
However, simply saying “Expected Move = 68%” is not enough; the calculation method you choose significantly impacts the precise range prediction.
The difference could be huge, illustrated clearly on the $VXX TradingView chart above, where various types of Expected Move lines are automatically visualized.
Why Understanding Expected Move Matters in Options Trading
The Expected Move represents the price movement anticipated by the options market within a specific expiration period, indicating where a stock’s spot price will most likely land, with a 68% probability.
Understanding the Expected Move gives traders insights into how the market prices volatility, aiding strategic decisions around buying or selling positions. Different methods of calculating Expected Move cater to varying market conditions, each with unique characteristics.
Market Dynamics in Options: Volatility Equals Risk, Stability Equals Predictability
In options, we distinguish between symmetrical and directional Expected Moves, binary and standard moves, and even calculations based solely on options deltas. Let’s break down the major types of Expected Move and when to use them.
Before we dive in, make sure you understand the exact definition of a binary event.
A binary event is classified as an upcoming announcement with an uncertain outcome. These events do not catch the market off guard; they are anticipated and typically come with a level of volatility that reflects overall market uncertainty.
Examples include earnings reports, major political announcements, or significant Fed events.
Breaking Down Expected Move: What Every Options Trader Needs to Know
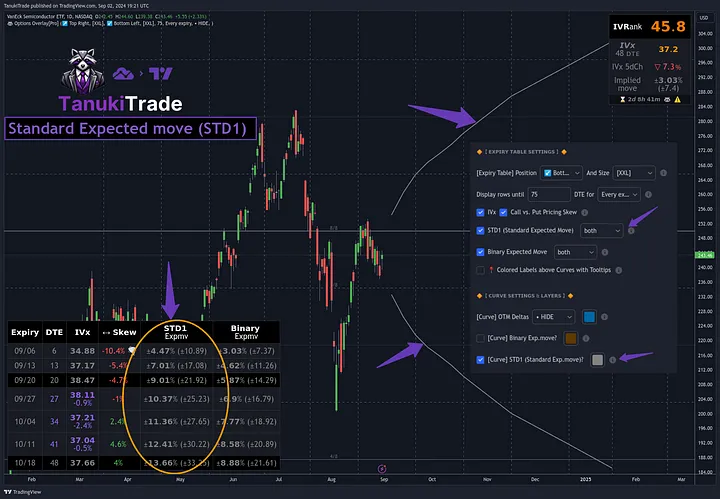
1. Standard Expected Move (STD1): The Calm Before the Storm
The Standard Expected Move is used when no binary event is anticipated (e.g., earnings reports, major political announcements, or significant Fed events). This type captures the most probable 68% price range and is based solely on the aggregated implied volatility (IV) of a given expiration. It is a symmetrical calculation reflecting a market without extraordinary events.
Calculation of Standard Expected Move: The calculation involves multiplying the closing price of the stock by the implied volatility and then multiplying that result by the square root of the ratio of the days to expiration divided by 365.
Here’s the Python code: standard_deviation = closing_price * implied_volatility * (days_to_expiration / 365) ** 0.5
Ideal Usage: STD1 is best used in stable or sideways-trending markets with no foreseeable event likely to cause significant movements. It’s the go-to calculation for most distant expirations. Below, the standard expected move is visualized as a gray line on a TradingView chart of $SMH, with expiration values highlighted.
2. Binary Expected Move (BEM): Capturing Event-Driven Volatility
BEM is used when a binary event is expected, or when options are near expiration. In these scenarios, implied volatility — especially for near-term expirations — spikes, making standard calculations less accurate. Binary events might include earnings reports, major policy announcements, or significant Fed events. BEM focuses on the most volatile option prices near the At-The-Money (ATM) point.
BEM Calculation (the TastyTrade Method)
The Binary Expected Move is calculated using a weighted sum of the ATM straddle price and the prices of the first and second Out-Of-The-Money (OTM) strangles.
- Multiply the price of the ATM straddle by 0.6.
- Multiply the price of the first OTM strangle by 0.3.
- Multiply the price of the second OTM strangle by 0.1.
- Sum these three values.
binary_expected_move = (atm_straddle_price * 0.6) + (first_otm_strangle_price * 0.3) + (second_otm_strangle_price * 0.1)
Characteristics
The Binary Expected Move suggests a narrower range than the Standard Expected Move, making it more precise in predicting expected market reactions in binary risk scenarios. Although symmetrical, it represents a tighter range, accurately reflecting the true 68% probability area because the Standard Expected Move can become skewed due to increased IV from binary risk, making realistic options around it harder to find.
In the chart below, the Binary Expected Move and range are shown in brown, corresponding to each expiration.
3. Implied Move: The Essential Metric Before Earnings
The Implied Move reflects the expected price range for the nearest expiration, particularly ahead of a known binary event like an earnings report. It often represents the anticipated market movement for the current week, helping traders optimize their positions. Basically this is the closest binary expected move.
Application: Implied Move is frequently used before earnings reports or other binary events, helping traders optimize their positions.
Example: For $AVGO, which has an earnings report on Thursday, the implied move is derived from the earliest expiration (09/06), suggesting a 68% chance that the price will remain within ±11.15 (±6.85%) after the report, based on current market pricing.
4. The Delta Neutral Probability Range (Directional Expected move)
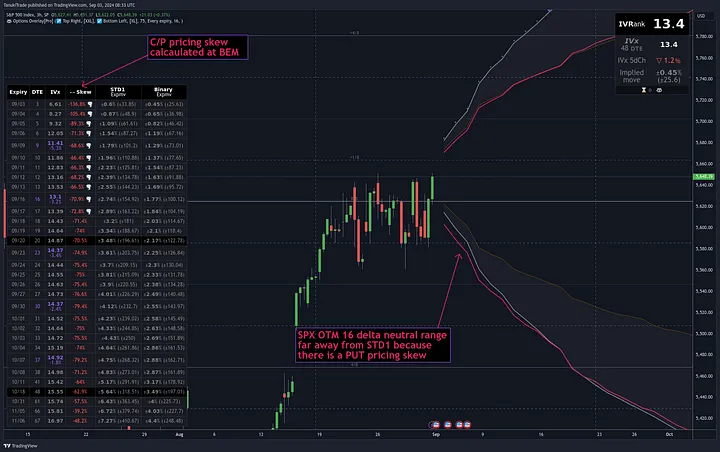
This represents the 68% probability range defined by OTM 16 delta PUTs and OTM 16 delta CALLs, showing a clear directional expected move value. It provides an insightful view of the expected price movement’s directional range, often used by delta-neutral strangle traders like those at TastyTrade.
Why Examine OTM Deltas?
When this range significantly differs from the standard and binary expected moves, it indicates delta skew, accounting for option chain distortions that suggest directional market bias. While BEM focuses on ATM options, this type of Expected Move specifically looks at OTM prices.
In the SPX example below, you can see how the delta-neutral range can deviate from the symmetrical range when the pricing of PUT options is significantly higher than CALL options, causing the OTM delta to fall well below STD1.
SummaryWhy Examine OTM Deltas?
When this range significantly differs from the standard and binary expected moves, it indicates delta skew, accounting for option chain distortions that suggest directional market bias. While BEM focuses on ATM options, this type of Expected Move specifically looks at OTM prices.
In the SPX example below, you can see how the delta-neutral range can deviate from the symmetrical range when the pricing of PUT options is significantly higher than CALL options, causing the OTM delta to fall well below STD1.
Understanding and correctly applying Expected Moves is essential for options traders. The Standard Expected Move helps in stable market conditions, while Binary and Implied Moves are particularly useful before binary events, where drastic price changes are anticipated. The directional delta probability range allows traders to spot market distortions and fine-tune their options strategies accordingly.
Each type conveys different information, and knowing how to use them effectively enables traders to adapt their strategies to various market situations. It’s crucial to keep an eye on market changes and consciously apply these metrics in your trading decisions.
It might seem like a small detail, but consider this: it’s not the same to trade a breakout on the last chart with a CALENDAR or a credit BWB. One thing is sure: seeing this PUT-skew chart, I hope no one who truly understands options would buy a single-leg PUT if they want to trade downward — there’s always a better way.
Let’s trade smart and make informed decisions with options!
Gregory Peter Szilagyi,
Founder of TanukiTrade Options
Attachments
Last edited by a moderator:
") That’s exactly why there are four different metrics in the
That’s exactly why there are four different metrics in the 