Thank you for your insights and critical feedback! I appreciate that you took the time to share your detailed thoughts on the different Expected Move calculation methods, and these professional discussions truly help us all to better understand the topic.
- Normal vs. Lognormal Distribution
You are absolutely right that the Standard Expected Move (STD1) calculation assumes a normal distribution, which is symmetric and does not account for the lower boundary of stock prices (prices cannot be negative). It’s important to clarify this difference, and indeed, it would be more accurate to consider lognormal distributions when discussing probability distributions in the options markets. The STD1 calculation is more of a simplified tool to estimate the general boundaries of market volatility rather than a precise forecast.
- Binary Expected Move (BEM)
The BEM aims to provide a straightforward method for predicting expected moves in event-driven market scenarios. Your point that the BEM probability might be lower than the standard 68% range is valid, and it would be worth emphasizing this more clearly in the article. This method originates from TastyTrade and offers an approximation that focuses more on weighing market reactions rather than mapping a strict probability distribution.
- Offering Multiple Methods
The various Expected Move calculations are included in the article to give traders a range of tools because there isn’t a single “best” method that applies to every market scenario. The goal was to present different perspectives that traders can use based on their individual preferences and market conditions.
It’s important to highlight that
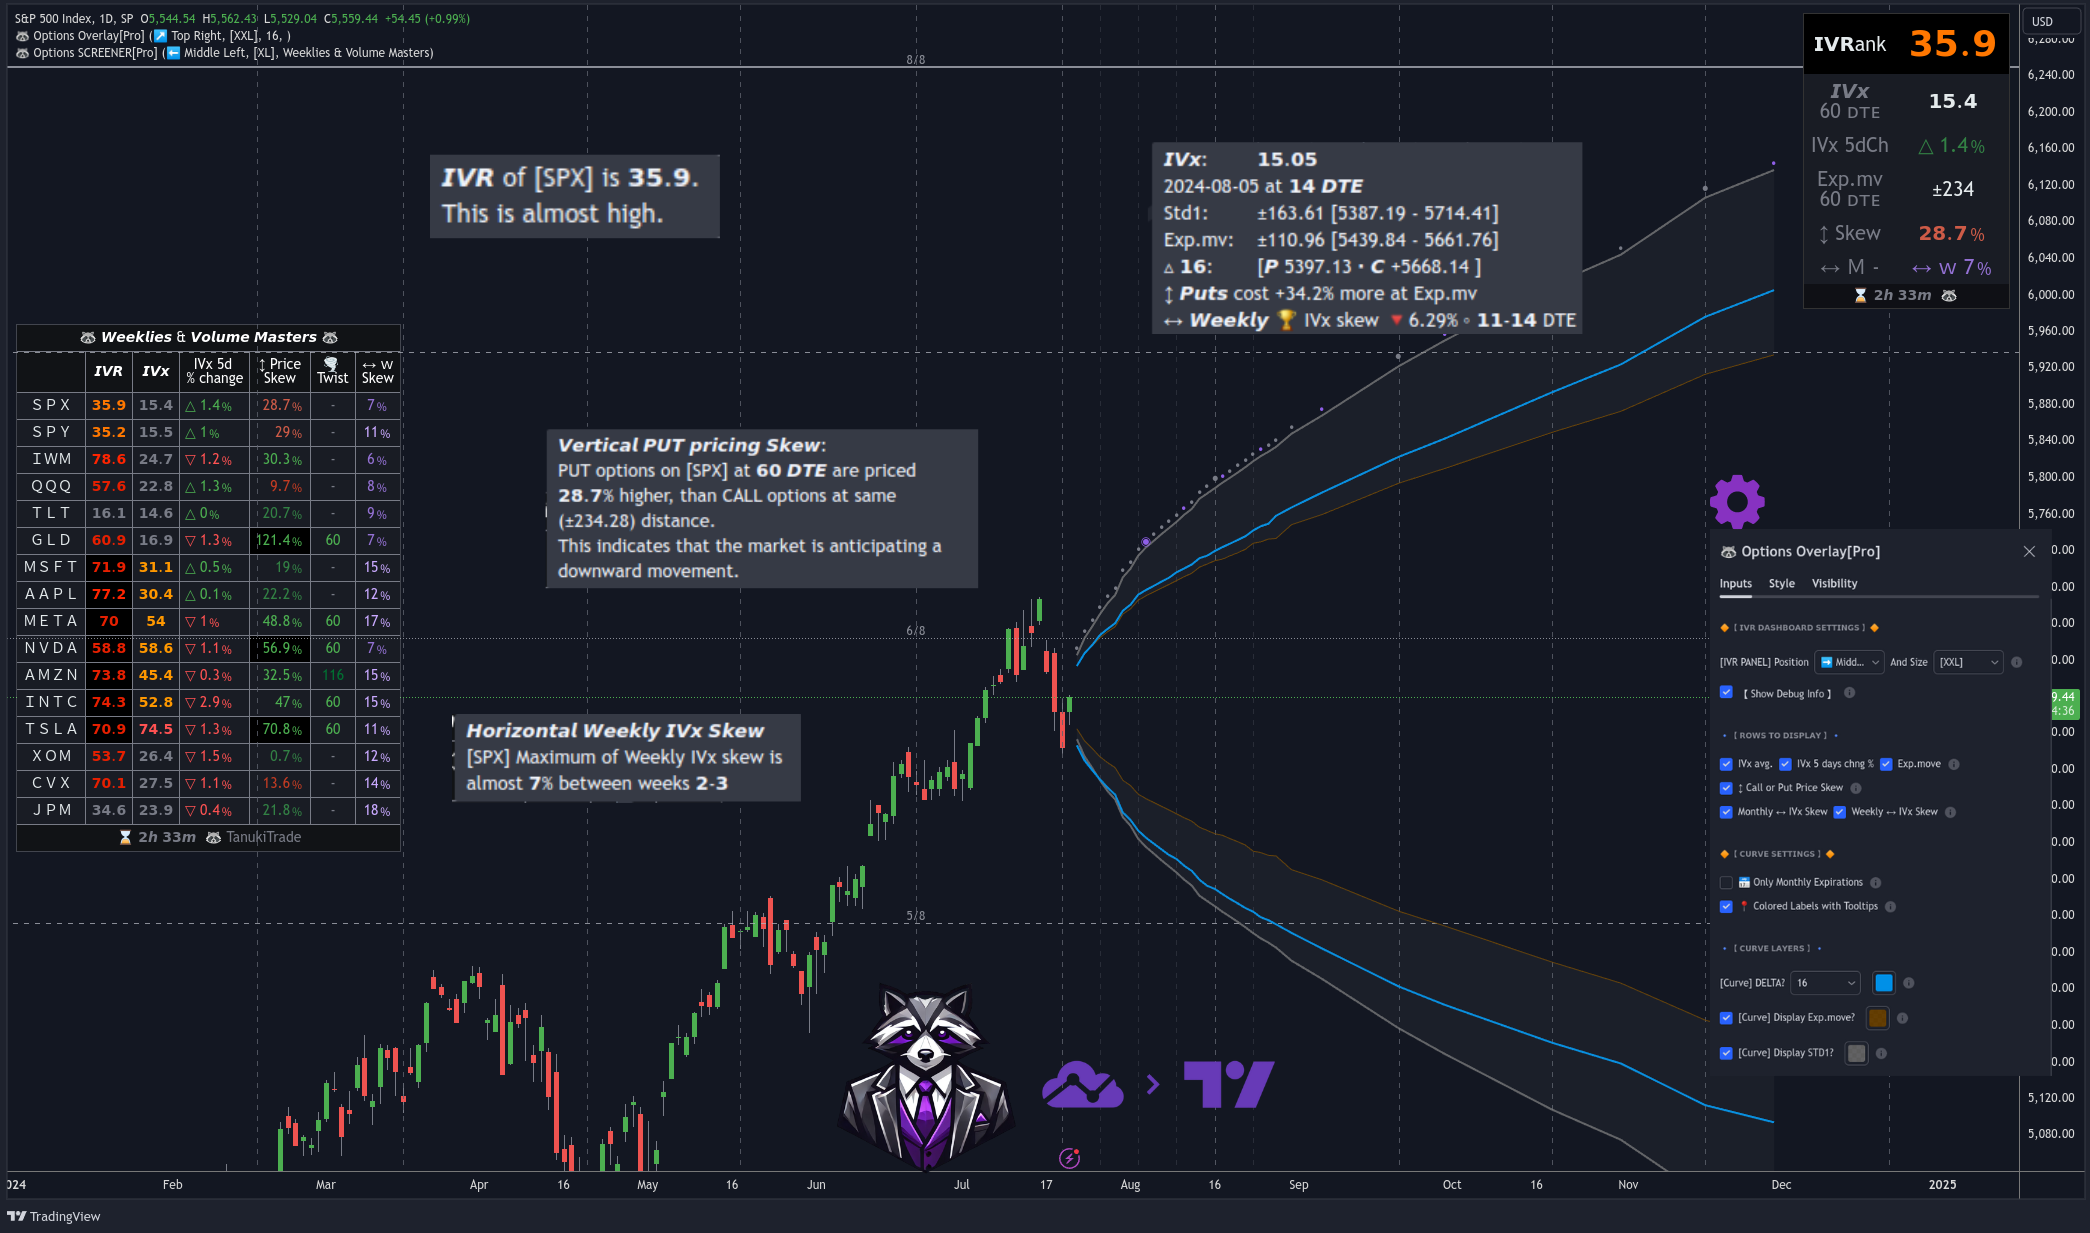
before the TanukiTrade Options Overlay indicator, there was no tool on TradingView that considered options pricing data in such a visually accessible form.
According to feedback from active options traders, the indicator performs well because it finally allows them to see the same data visualized on their charts as they do on their broker platforms, but without the need to monitor two windows simultaneously. This visualization significantly enhances decision-making and improves the trading experience.
The main goal of
my project was exactly this: to create a high level options tool for that provides practical assistance for retail traders, not to develop a quant-level tool that would require further refinement of probability distributions. Of course, many probability distributions, such as lognormal or MED, could be integrated, but our target audience—retail traders using the options overlay indicator—do not necessarily need more than this in practice. This is why the indicator has been successful.
Thank you for your comments, and I look forward to continuing the dialogue with the community to further enhance this tool according to traders’ needs.
Best regards,
Gregory Peter Szilagyi
TanukiTrade.com