
You are using an out of date browser. It may not display this or other websites correctly.
You should upgrade or use an alternative browser.
You should upgrade or use an alternative browser.
How to calculate Std Dev
- Thread starter nicbizz
- Start date
Have you tried using one of the wonders of modern technology, these gizmos called Internet search engines? There's one called Google and it's swell  .
.
Here you go:
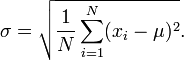
.Here you go:

1. decide what length of time to calculate the standard of deviation over.
2. Calculate the mean (average) of this list of numbers (say of the close, if you are using the closing price, which is standard)
3. Subtract the mean from each data point you are using (each closing price).
4. Take each resulting numbers and square each of them.
5. Sum each of these "squared" numbers
6. Divide this total by one less than the total data points you are using. (if it is a 20 day St. dev, divide by 19).
7. Take the square root of this number. This gives you the standard deviation.
2. Calculate the mean (average) of this list of numbers (say of the close, if you are using the closing price, which is standard)
3. Subtract the mean from each data point you are using (each closing price).
4. Take each resulting numbers and square each of them.
5. Sum each of these "squared" numbers
6. Divide this total by one less than the total data points you are using. (if it is a 20 day St. dev, divide by 19).
7. Take the square root of this number. This gives you the standard deviation.
Quote from 1prometheus:
2. Calculate the mean (average) of this list of numbers (say of the close, if you are using the closing price, which is standard)
3. Subtract the mean from each data point you are using (each closing price)[/B]
If you're actually coding it, this is the one-pass technique, http://www.strchr.com/standard_deviation_in_one_pass (meaning, you don't need to go thru the data once to calculate the mean, then back thru again)
If you plan to use statistical analysis in your trading to generate your entries and such, then it would be in your interest to better familiarize yourself with statistical theory. For example, unless your sample size is sufficient, dependent on the variability of the data set in your calculation, then your SD will be meaningless and give you a false sense of security. Therefore, I'd be careful about becoming too reliant on the numeric specificity of the results if I were you. Also, are you assuming a normal distribution or something better fitting? Remember what they say about a little bit of knowledge...Quote from nicbizz:
I apologize in advance if this is a really dumb question, but when I read about RTM strategies based on x number of std deviations, how does one calculate that on a particular stock/future?
Is it based off a MA, like Bollinger Bands or Keltner?
Thanks
Quote from nicbizz:
The jibes are well-deserved, I should've phrased it better
What I meant was, if I wanted to test out RTM strategies, would 20-MA Bollinger Bands and x std-deviation be an approximate measure on a daily / intraday basis?
There are some reversion to mean traders here who do pretty well from what I've read. Check out the journal "grinding it out day after day."
As for your indicators, that depends on you, the trader.