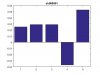
I survey on the ups and downs of one stock in the past 3000 trading days and sort them by week day: Monday (ups53%, 0.53-0.5=0.03), Tuesday(ups55%, 0.55-0.5=0.05),... like this; Then I get a picture which is in the attached files:
Then how shall I confirm the difference between week days is significant or just random?
Then how shall I confirm the difference between week days is significant or just random?