How many higher highs/lower lows then is considered a trend?

Well, everybody has their reasons for being on the forum: some are here writers, some are readers, some are for entertainment, some are for knowledge, but I suspect that to teach somebody how to trade is at the very last of the list of reasons :),

Anyway to expect from people the whole truth is to "insult their intelligence" , and nobody, I believe, is trying to misinform or to lie to the OP, he was given some truth, which is better than nothing........

:)
%%
Good points, especially when we are not aiming @ lies. But like one lawyer said ''the whole truth- that IS pretty ambitious''LOL, The whole truth[a-z] is not practical in a time sense unless one uses a yes or no answer. ....LOL:caution::D Plenty of good , truthful answers, here.
 
You're right, naming a trend is easy, but you stop short of what's really useful for traders - evaluating which trend to go with first out of 38 charts.
If you are looking at 38 charts, then you are mistaken to think you are taking anything valuable away. A trend by the book, is formed by 3 confluencing points. In my view, in the traditional sense, it should be 2 tops or bottoms and you can trade to a point where a 3rd may be made.
 
Which of these two instruments has a definite trend?

Crude oil? http://www.macrotrends.net/1369/crude-oil-price-history-chart

Or S&P? http://www.macrotrends.net/2324/sp-500-historical-chart-data

It is clear that going long-term up in S&P is a good bet, while WTI is a bit more dicey to choose a long-term direction.
It all depends on how you want to trade them? Intraday? Overnight swings, multi week swing, or 6 months to a year swing? The longer your time horizon, the bigger the charts and trends you need to identify.
 
can see, can't see,

all the problems because most talkers do not have the clear, precise definition of the trend, usable as a part of the method

can u provide one?

but remember: the whole truth, and nothing but(t).... he-he
i have plenty, check twitter on @timdug for some trade screenshots of me trading my own book. I cant share most of my trades now as I am with a firm.
 
If you are looking at 38 charts, then you are mistaken to think you are taking anything valuable away. A trend by the book, is formed by 3 confluencing points. In my view, in the traditional sense, it should be 2 tops or bottoms and you can trade to a point where a 3rd may be made.


This standard definition of a trend is correct and confirms it but does not rank it by preference for an actual trade. If using a trend-following strategy, multiple targets will be appropriate, as trends are only seen in any given single market for a minority of the time. It is therefore very practical to have some way of assessing which trend-following trade would be best for the individual's strategy.
 
oil down for the first 6 months of 2017 - there is a major swing trend. Look at the daily continuation chats for WTI. Its not rocket science. Draw some trend lines on it. Then pick your entry and exit zones. The same principals apply to intraday. as far as I can tell, though I dont professionally hold overnights, so am merely speculating against any long term personal equities I have held.
Are we getting away from the question?
 
plenty definitions.. :)
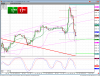
This has a trend that was formed over 2 months cutting right through the intraday chart providing support.

This one is a trend channel on RBOB over a week where I sold it on the back of this channel..
Here is another on WTI forming a trend channel

here is another with a breakout
h
<blockquote class="twitter-tweet" data-lang="en"><p lang="en" dir="ltr"><a href="https://twitter.com/hashtag/NASDAQ?src=hash&amp;ref_src=twsrc^tfw">#NASDAQ</a> sold the top. These highs are <a href="https://twitter.com/hashtag/crazy?src=hash&amp;ref_src=twsrc^tfw">#crazy</a> <a href="https://t.co/08xRtkOBXI">pic.twitter.com/08xRtkOBXI</a></p>&mdash; Tim Duggan (@timdug) <a href=" ">August 8, 2017</a></blockquote>
<script async src="https://platform.twitter.com/widgets.js" charset="utf-8"></script>


here is another forming a flag

here is another on euro, multi day trend where price will move up to test it and either break, or in the case of multi week trend, reject it, endorsing the resistance.

and on and on and on......

PM me if anyone wants to go through anything with me.
Trends are some (if not) the strongest future indicators there are in the markets in my mind.
 
another I stumbled across trying to find some fib charts. In this NASDAQ chart, you can see where a multi day trend I drew provided resistance, then when broken, turned to support to endorse the long. I liked this trade a lot actually as I sold the top and held it until the bottom. This is the type of trade I live and breathe for.
 

Attachments

  • NASDAQ2_preview.png
    NASDAQ2_preview.png
    397 KB · Views: 14
Back
Top