
You are using an out of date browser. It may not display this or other websites correctly.
You should upgrade or use an alternative browser.
You should upgrade or use an alternative browser.
How Do You Trade Channels for Price Action Traders ?
- Thread starter ImAmine
- Start date

There are some good traders on ET but an even larger number of the clueless who none the less don't lack for opinions. Everybody sees things differently, my advice would be to spend many hours watching price development. Draw channels if that's what you want to explore...patterns of price behavior will begin to emerge over time. Ultimately, you will have to trade what you see and not what someone else see's or claims to see.
Regarding trading channels; it can be quite a vast concept. First off; you're going to need to find some objective procedure for drawing channels as best as you're able. Remove as much subjectivity as possible or you will get nowhere.
The most commonly advocated method for beginners is to enter into a trend that is already existing. Every channel has a slope. The direction of the slope is the dominant direction of the trend. There will be non-dominant movement against the trend slope intermittently as higher highs or lower lows are made.
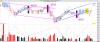
So you need to find a way to qualify the dominant direction of a trend; wait for non-dominant; and then enter into the return to dominance. Here are some basic entries of this type from ES yesterday. The dominant direction was qualified; non-dominant movement ran it's course, and then price began translating once again in the dominant direction. There are additional considerations such as exits and risk metrics for you to develop; but I'd recommend focusing on one thing at a time and making iterative refinements when you discover them.
If you study this example you may realize these entries were triggered by objective criteria and not merely cherry picked with the benefit of hindsight which is the assumption most people usually jump to.
The most commonly advocated method for beginners is to enter into a trend that is already existing. Every channel has a slope. The direction of the slope is the dominant direction of the trend. There will be non-dominant movement against the trend slope intermittently as higher highs or lower lows are made.
So you need to find a way to qualify the dominant direction of a trend; wait for non-dominant; and then enter into the return to dominance. Here are some basic entries of this type from ES yesterday. The dominant direction was qualified; non-dominant movement ran it's course, and then price began translating once again in the dominant direction. There are additional considerations such as exits and risk metrics for you to develop; but I'd recommend focusing on one thing at a time and making iterative refinements when you discover them.
If you study this example you may realize these entries were triggered by objective criteria and not merely cherry picked with the benefit of hindsight which is the assumption most people usually jump to.
Attachments
There are some good traders on ET but an even larger number of the clueless who none the less don't lack for opinions. Everybody sees things differently, my advice would be to spend many hours watching price development. Draw channels if that's what you want to explore...patterns of price behavior will begin to emerge over time. Ultimately, you will have to trade what you see and not what someone else see's or claims to see.
Thank You Speedo...
I understand what you mean...It's true I do lack screen time experience to be able to see the patterns of price behavior emerge !
Regarding trading channels; it can be quite a vast concept. First off; you're going to need to find some objective procedure for drawing channels as best as you're able. Remove as much subjectivity as possible or you will get nowhere.
The most commonly advocated method for beginners is to enter into a trend that is already existing. Every channel has a slope. The direction of the slope is the dominant direction of the trend. There will be non-dominant movement against the trend slope intermittently as higher highs or lower lows are made.
So you need to find a way to qualify the dominant direction of a trend; wait for non-dominant; and then enter into the return to dominance. Here are some basic entries of this type from ES yesterday. The dominant direction was qualified; non-dominant movement ran it's course, and then price began translating once again in the dominant direction. There are additional considerations such as exits and risk metrics for you to develop; but I'd recommend focusing on one thing at a time and making iterative refinements when you discover them.
If you study this example you may realize these entries were triggered by objective criteria and not merely cherry picked with the benefit of hindsight which is the assumption most people usually jump to.
Thank You llIHeroic
My method for drawing channels is to connect two swing highs and two swing lows at the start of a trend. I still didn't figure out a good way for drawing channels as objectively as possible. This is why it's still confusing (But also I'm new to trading, maybe that's why!)
In the picture you attached, I don't understand how did you draw the major channel. I mean how can you tell if the trend lines and channel lines are sloped like that ? There is only one point from where the lines are drawn! Don't you think there should be two points above and two points below in order to draw a channel ?
I'm asking that because I see that in the second swing high where the trend line is drawn, there is "Entry short"! How can that be if we still didn't determine where is the second point to connect to have a trend line...
Thanks again. Your guidelines are very helpful...
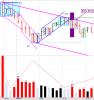
I draw in the channels on multiple levels of resolution as soon as there is sufficient data to do so. Once there are two points to create a right trendline, I clone the RTL and place it on the point of maximum volatility between "P1" and "P3". I adjust my trend-lines as future data forms and fan or steepen them according to certain criteria until they reach "completion" and then I start a new channel in the opposite direction. Here's what my chart would've looked like in RT at the first short entry.
The method is very nuanced. Forum users Jack Hershey and Spydertrader wrote much about this method of drawing channels and related concepts over the years; I'm sure you will eventually come across their works or references to it if you poke around here long enough.
However, the purpose of my post was not particularly to get into the mechanics my own trend channel drawing. Rather I wanted to speak to the underlying principles on how to begin exploring trading with channels. As speedo says, before anything else a copious amount of screen time is really necessary to make progress with this stuff. I merely wanted to leave you with a few other pointers that I believe are helpful to someone starting out on this path. Best of luck.
1. Screen Time
2. Objective Criteria for Annotations
3. Specialize in one specific trade at first [i.e. return to dominance]
4. A consistent set of rules for all trading actions
5. Don't scatter your focus
The method is very nuanced. Forum users Jack Hershey and Spydertrader wrote much about this method of drawing channels and related concepts over the years; I'm sure you will eventually come across their works or references to it if you poke around here long enough.
However, the purpose of my post was not particularly to get into the mechanics my own trend channel drawing. Rather I wanted to speak to the underlying principles on how to begin exploring trading with channels. As speedo says, before anything else a copious amount of screen time is really necessary to make progress with this stuff. I merely wanted to leave you with a few other pointers that I believe are helpful to someone starting out on this path. Best of luck.
1. Screen Time
2. Objective Criteria for Annotations
3. Specialize in one specific trade at first [i.e. return to dominance]
4. A consistent set of rules for all trading actions
5. Don't scatter your focus
Attachments
Thank You llIHeroic,
I understand now what you meant. What you said is very logical... I'll do my best to follow those guidelines you mentioned.
btw I've found the writing of Jack Hershey and Spydertrader...Thank you very much for directing me!
Your answers were exactly what I needed to know!
Good Luck in your trading llIHeroic
I understand now what you meant. What you said is very logical... I'll do my best to follow those guidelines you mentioned.
btw I've found the writing of Jack Hershey and Spydertrader...Thank you very much for directing me!
Your answers were exactly what I needed to know!
Good Luck in your trading llIHeroic
Personally, I use channels to track weakness and strength of a move. Bottom of the channel is usually an area of demand while the top is usually an area of supply. Of course this depends on the major trend itself.
I hate to be a dick, and maybe I'm wrong, but from my point of view, what you draw is highly hindsight laden. Take the first trendline you have, the downslopping one that is magenta. It should be extended, as I have drawn via the red line, and it perfectly hits point C on my version of your chart. Therefore, there is no reason for you to stop drawing in this trendline, except if you knew that an uptrend was coming.I draw in the channels on multiple levels of resolution as soon as there is sufficient data to do so. Once there are two points to create a right trendline, I clone the RTL and place it on the point of maximum volatility between "P1" and "P3". I adjust my trend-lines as future data forms and fan or steepen them according to certain criteria until they reach "completion" and then I start a new channel in the opposite direction. Here's what my chart would've looked like in RT at the first short entry.
The method is very nuanced. Forum users Jack Hershey and Spydertrader wrote much about this method of drawing channels and related concepts over the years; I'm sure you will eventually come across their works or references to it if you poke around here long enough.
However, the purpose of my post was not particularly to get into the mechanics my own trend channel drawing. Rather I wanted to speak to the underlying principles on how to begin exploring trading with channels. As speedo says, before anything else a copious amount of screen time is really necessary to make progress with this stuff. I merely wanted to leave you with a few other pointers that I believe are helpful to someone starting out on this path. Best of luck.
1. Screen Time
2. Objective Criteria for Annotations
3. Specialize in one specific trade at first [i.e. return to dominance]
4. A consistent set of rules for all trading actions
5. Don't scatter your focus
Where you draw your new channel, in blue, looks completely done in hindsight. Your long entry at F is actually a long entry during a down move. You have B and C which are both lower highs, and E which a lower low from D. Therefore, taking a long at F is simply silly. Perhaps you wanted to scalp because your tiny magenta channel was broken, but you're taking a very risky long, in a down trend!
Furthermore, the channel you start drawing from E to F as your lower line is completely hindsight because there is no reason to connect the swing low at F until it becomes clear much later that this was in fact going to be a low point. If you can tell me exactly why where you mark your long you knew this was a low, I would be very impressed, but I see no reason for this. Your lines only make sense after the chart was formed.

I'm a price action trader and I'm building a system over channels but I found them very subjective and confusing.
Mathematically define them
