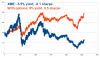
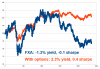
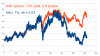
How do these equity curves look in the eyes of a trader?

So I arrived at a trading strategy that seems pretty good for my reckoning. It's something I developed incrementally through study of finance / quant theory, experimentation and use of a software tool I programmed. Also I'm using real historical options market data to backtest in addition to theoretical validation (simulated data).

The purpose is obviously to make money eventually but achieving this is a bit more complex than "trade your own account and go from $10k to $10MM in a couple of years".

As I see it, having a tool to research and develop strategies is essential to eventually getting them to work. So I thought of perhaps making money also by selling the tool, but of course this is a lot like selling tools to miners. You're a lot more credible the tools are worth something if you successfully use them yourself to mine and find gold.
 
SPX.png


QQQ.png
 

Attachments

  • XAU.png
    XAU.png
    62.2 KB · Views: 28
  • XME.png
    XME.png
    52.9 KB · Views: 26
  • FXA.png
    FXA.png
    53.6 KB · Views: 27
Several things:

- The strategy is not making pigs fly but it consistently and reliably outperforms a simple long position on the underlier. If the underlier is very bad-behaved and would lose money, you won't get a terrific yield and Sharpe, but it's very probable that my strategy will still be profitable while a simple long position would lose money.
- The strategy is very scalable both in terms of amounts of capital one can invest on a single underlier and by the fact that it's covering a large class of underliers: stocks and indices.
- Target audience is definitely not the Robinhood trader with $2000-$3000 in their account.
 
Good equity curve. But be careful of overfitting. Try to introduce uncertainty into your backtest by introducing monte carlo simulations, bootstrapping, block bootstrapping. Next carry out walk forward or expanding window backtesting.

And average or weight different trading rules for robust results.
 
OK, will rename it "annual return". I just liked how "yield" sounds a bit more.
%%
OK;
+ most likely you will do better than that-on SPY/over the years.........................................................................................[SPXL......... may do better sometimes also]
 
Good equity curve. But be careful of overfitting. Try to introduce uncertainty into your backtest by introducing monte carlo simulations, bootstrapping, block bootstrapping. Next carry out walk forward or expanding window backtesting.

And average or weight different trading rules for robust results.

I mentioned about walk-forward tests above. I wrote a simple python package here to generate indexes of dataset for the training, testing and boostrapping indexes. You may check it out under pypi page and pip install if you find it useful,

https://pypi.org/project/bootstrapindex/
 
Back
Top