How can Nikkei 225 not recover after so many years?

Quote from short&naked:

The anser is quite simple and can be found in demographics. Part of the reason is that the demographic that consisted of stock buyers who reached their peak in 1989, could not be replenished by the next generation.

Instead of looking at monetary policy, consider what will happen when the boomers retire. The next generation is a) not as great in number b) more in debt than the boomers were.

It doesn't get more deflationary than this. And now that the credit markets have lost confidence, the fed may have lost the power to prevent the upcoming deflationary shit storm. Just take a minute and look at the following chart, it says it all. And this doesn't just apply to stocks but to all asset classes. Liquidate. NOW.

2nk1cox.jpg


i don't think the answer is that simple. what about billions of new investors from BRIC, etc?
 
Quote from dhpar:

i don't think the answer is that simple. what about billions of new investors from BRIC, etc?

Why does an explanation always have to be complex? To make us feel more intelligent? Have a look at the following chart:

2bcsxe.jpg


As for investors from BRIC, much of their wealth has been based on a general lower interest rate (YEN at .5%) and money supply bubble, once this money is pulled (as is currenctly the case), that "wealth" can easily disappear. And yes, BRIC was a bubble (just like Housing, AG, etc...).
 
short&naked, I don't see how you can apply the birth rate of the US to the commodity asset class, since it's global. Do you have a world chart?
 
Quote from short&naked:

Why does an explanation always have to be complex? To make us feel more intelligent? Have a look at the following chart:

2bcsxe.jpg


As for investors from BRIC, much of their wealth has been based on a general lower interest rate (YEN at .5%) and money supply bubble, once this money is pulled (as is currenctly the case), that "wealth" can easily disappear. And yes, BRIC was a bubble (just like Housing, AG, etc...).

of course if you prefer we can keep it simple - e.g. everything is a bubble including Chinese labor working 24/7 for tenth of the American wage... by definition BRIC people do not have right to invest into stocks for their pensions...this is a privilege for western folks.
 
Quote from short&naked:

Why does an explanation always have to be complex? To make us feel more intelligent? Have a look at the following chart:

2bcsxe.jpg


As for investors from BRIC, much of their wealth has been based on a general lower interest rate (YEN at .5%) and money supply bubble, once this money is pulled (as is currenctly the case), that "wealth" can easily disappear. And yes, BRIC was a bubble (just like Housing, AG, etc...).

Hi shortnaked,

What is the purpose of showing this chart? And the purpose of showing N225 in constant Yen terms? Is it savings rate has been increasing in Japan and yen has strengthen??
 
Someone correct me if I am wrong, but isn't the N225 and the Dow set to the same value when the N225 was invented? If this is the case, then the argument about hardwork and growth doesn't apply -- it just says that Japanese and Americans ended up with the same long term growth despite path differences due to monetary policy that should have no long run effect.
 
Quote from noddyboy:

Someone correct me if I am wrong, but isn't the N225 and the Dow set to the same value when the N225 was invented? If this is the case, then the argument about hardwork and growth doesn't apply -- it just says that Japanese and Americans ended up with the same long term growth despite path differences due to monetary policy that should have no long run effect.

When the N225 was started on September 7, 1950 at around 100, the DJIA was around 220.
 
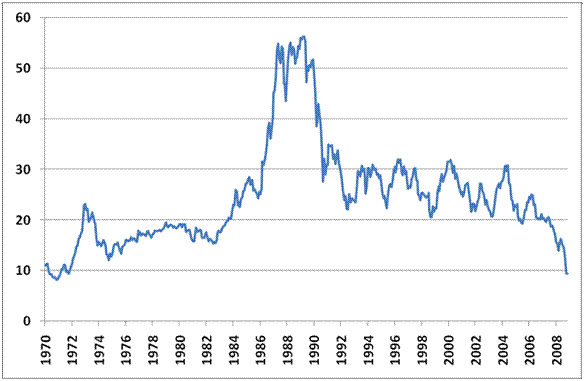
Quote from makloda:* Regarding historic PE ratios. I have searched for a long term Topix or Nikkei PE chart of Japan (1970 - today) a while ago and couldn't find any. Anybody with access to a Bloomberg could please post one? Or maybe somebody with any other source. Thanks.
Found one :cool:

wmc081201c.gif
 
can u also post the p/e chart for the Dow or sp500?

N225 valuation in the 80s is p/e50...crazy stuff. How much would the Dow be on that kind of p/e? Probably 40,000?
 
Back
Top