You are using an out of date browser. It may not display this or other websites correctly.
You should upgrade or use an alternative browser.
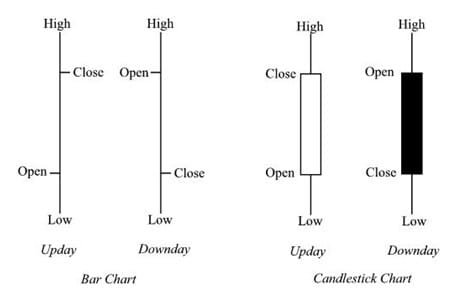
You should upgrade or use an alternative browser.
How can i see the gap in the market with a broker that doesn` t show gaps
- Thread starter andy_p
- Start date

You don't have to wait for the first bar to close. Your entry isn't some EXACT price.
As soon as the new day starts, the gap close trade can be taken. I think most gap traders will use the market open price as Sprout explained above. Some will place a buy/sell stop above/below the first 1 minute bar so price is moving towards the gap before entering.
I think statistics show the gap fills 70-80% of the time but what do you do if it doesn't fill? You need some plan or likely get burned. Looking at the chart above, Monday the gap filled after about 20 minutes but Tuesday the gap never filled and Wednesday it took 3/4 of the day to fill.
The system which I`m trading and I can`t give out details here does exactly that it shows you how to trade gaps on the NASDAQ the problem is the creator of the system doesn`t offer me any kind of support. I know I`m a slow learner and he won`t offer me any more support after I don't know 10-20 emails. The only thing I haven`t mastered is how to see the gap when the broker doesn`t show it. I need to learn to see the gap and trade it. This is why I`m asking for help here.
The system which I`m trading and I can`t give out details here does exactly that it shows you how to trade gaps on the NASDAQ the problem is the creator of the system doesn`t offer me any kind of support. I know I`m a slow learner and he won`t offer me any more support after I don't know 10-20 emails. The only thing I haven`t mastered is how to see the gap when the broker doesn`t show it. I need to learn to see the gap and trade it. This is why I`m asking for help here.
This method I showed yesterday takes just a couple minutes.
1-Place vertical line @ 4 PM (yesterday's close ... Eastern Time in US)(use 3:55 for Min.5 chart)
2-Place horizontal line @ the closing price of the candle/bar on the vertical line (for bar charts it's the right dash of the bar)
3-Trading day .... Place a vertical line @ 9:30 AM (today's open)
4-The gap is the distance between the opening price and the horizontal line
***Study the chart below a little. It's just like the chart you're trying to trade with.
What platform are you using? It may have an indicator that can put the horizontal line on automatically every day.
***S&P500 below

The system which I`m trading and I can`t give out details here does exactly that it shows you how to trade gaps on the NASDAQ the problem is the creator of the system doesn`t offer me any kind of support. I know I`m a slow learner and he won`t offer me any more support after I don't know 10-20 emails. The only thing I haven`t mastered is how to see the gap when the broker doesn`t show it. I need to learn to see the gap and trade it. This is why I`m asking for help here.
Get a different broker to trade MNQ, get real data to make real money. No shortcuts.
Sorry it`s too complicated I just needed to know on the bar chart do i look on the right or the left? for the first candle to form and close.This method I showed yesterday takes just a couple minutes.
1-Place vertical line @ 4 PM (yesterday's close ... Eastern Time in US)(use 3:55 for Min.5 chart)
2-Place horizontal line @ the closing price of the candle/bar on the vertical line (for bar charts it's the right dash of the bar)
3-Trading day .... Place a vertical line @ 9:30 AM (today's open)
4-The gap is the distance between the opening price and the horizontal line
***Study the chart below a little. It's just like the chart you're trying to trade with.
What platform are you using? It may have an indicator that can put the horizontal line on automatically every day.
***S&P500 below
View attachment 309193
Sorry it`s too complicated I just needed to know on the bar chart do i look on the right or the left? for the first candle to form and close.
I already posted the solution to you. Why is this thread still active?
Use a chart that only shows regular trading hours. If your current broker does not offer that, find another broker.
If you don't want to switch broker and still think @BKR88's method is too complicated, then just give up.
A gap from one day to the next is the difference from the closing price the prior day (16:00 on US index futures), i.e., the right side of the bar and the opening price of the first bar the next day, i.e., the left side of the bar.
Questions?
I`ve posted a new trade I`m looking for a new broker that shows gaps is available inI already posted the solution to you. Why is this thread still active?
Use a chart that only shows regular trading hours. If your current broker does not offer that, find another broker.
If you don't want to switch broker and still think @BKR88's method is too complicated, then just give up.
A gap from one day to the next is the difference from the closing price the prior day (16:00 on US index futures), i.e., the right side of the bar and the opening price of the first bar the next day, i.e., the left side of the bar.
Questions?
Romania and can place 1$ per pip trades and has CFD for NASDAQ-100
The question is do I look at the right or at the left of the bar chart to find out the time it has stoppedI already posted the solution to you. Why is this thread still active?
Use a chart that only shows regular trading hours. If your current broker does not offer that, find another broker.
If you don't want to switch broker and still think @BKR88's method is too complicated, then just give up.
A gap from one day to the next is the difference from the closing price the prior day (16:00 on US index futures), i.e., the right side of the bar and the opening price of the first bar the next day, i.e., the left side of the bar.
Questions?
The question is do I look at the right or at the left of the bar chart to find out the time it has stopped
Seriously, if you have to ask about this, you need a ton of study before attempting to do any live trading.
Gap trading on it's own won't get you far because some days they are filled while other days the markets will just continue on in the direction of the gap. To know the difference you need a more complete system.
The gap today is the difference from today's opening price (left side the bar) and yesterday's closing price (right side of the bar).