How am I doing on trying to find a strategy?

This is what I've been working on the past 2 nights. I downloaded an Excel spreadsheet of all the daily numbers for the S&P since 1991. So it's about 30 years of data.

I determined the following things...

The S&P goes up 53.54% of days, and down 46.4% of days.
It gains at least 1% on 12.8% of days, and loses at least 1% 11.9% of days.
It gains 2%+ 3.07% of days, -2% on 3.6% of days.
Gains 3%+ on 1.1% of days, loses at least 3% 1.2% of days.

The goal is to make a strategy that I can trade S&P emini futures on. Since this is so highly leveraged, I would be risking about 10% of the account if I waited for the index to gain/lose 1%.

So I went further and divided everything into decimals of a percent within the first percentile of gain/loss.

0.1% = gains 46.97% of days, loses 40.57% of days
0.2% = gains 41.19% of days, loses 34.85%
0.3% = gains 35.87%, loses 29.95%
0.4% = gains 31.47%, loses 25.97%
0.5% = gains 27.07%, loses 22.84%
0.6% = gains 23.37%, loses 20.11%
0.7% = gains 20.11%, loses 17.58%
0.8% = gains 17.34%, loses 15.51%
0.9% = gains 14.87%, loses 13.35%

Since I'm trying to do all of this as day trading. (meaning that I will close the trade within 24 hours of opening it), then the percentages of the stop-loss and take-profit should probably be at least 75% when added together to happen on any given day.

One thing that jumps out at me is that it's more likely for the index to gain 2% than it is to lose 1%. I always want to go bull, and I really want to do the same strategy every day. The market is bull unless something very strange is going on, such as recent times.

One other problem is that I'm having trouble entering both a stop-loss and a take-profit on the Schwab futures account. It wants me to have margin to cover both, as if I would want to execute both of them instead of just one or the other.

Thoughts? I'm happy to elaborate further or to do more research.

And I also know that this doesn't account for intraday volatilty, but that's a little too much research for me.

One think you might further consider: overnight ES rooms only trade longs at 3:39 pm EST, never shorts, b/c most gains are at night!!
 
So I had a wakeup call back to reality this morning. At 8:30am I had a call telling me that the new drywall finishers had gotten started and were doing a great job! (I build spec houses for a living. Actually just getting started after doing "flips" for a while). So I realize that I should be focusing on home building more than this.

And my "master plan" for figuring out the stock market is.... GO LONG ON THE S&P!!!! Hahaha. As if that takes a damn rocket scientist.

But this morning between 4am - 8:15am, I entered and lost SEVEN consecutive trades on the Micro e-mini S&P. These originally had stops of 0.3%TP and 0.2%SL, then changed to 0.4% and 0.3%. Seven in a row. Thank God I didn't bet very much. I only lost about $40 each trade.

So not much for a plan. Do I have any hope of tweaking that into something that might work? Well I think the problem is that with stops so close, I'm very much at the mercy of what the markets are doing on that very short timeframe. So it doesn't matter what the average of the S&P has been over the past 20 years because it's too small of a timeframe.

So if I were to try to change the plan, I would need to widen the stops. But with the leverage involved in futures contracts, that would put a large amount of my account at risk at once. Even a 1% change in the index amounts to a 10% change in account value.
 
So I had a wakeup call back to reality this morning. At 8:30am I had a call telling me that the new drywall finishers had gotten started and were doing a great job! (I build spec houses for a living. Actually just getting started after doing "flips" for a while). So I realize that I should be focusing on home building more than this.

And my "master plan" for figuring out the stock market is.... GO LONG ON THE S&P!!!! Hahaha. As if that takes a damn rocket scientist.

But this morning between 4am - 8:15am, I entered and lost SEVEN consecutive trades on the Micro e-mini S&P. These originally had stops of 0.3%TP and 0.2%SL, then changed to 0.4% and 0.3%. Seven in a row. Thank God I didn't bet very much. I only lost about $40 each trade.

So not much for a plan. Do I have any hope of tweaking that into something that might work? Well I think the problem is that with stops so close, I'm very much at the mercy of what the markets are doing on that very short timeframe. So it doesn't matter what the average of the S&P has been over the past 20 years because it's too small of a timeframe.

So if I were to try to change the plan, I would need to widen the stops. But with the leverage involved in futures contracts, that would put a large amount of my account at risk at once. Even a 1% change in the index amounts to a 10% change in account value.

Ok I just realized something very obvious that I'm pretty sure someone already told me.

I shouldn't care about the open and close price, I should care more about the entire range for the day. The day's high and low, and also the open price.
 
Ok I just realized something very obvious that I'm pretty sure someone already told me.

I shouldn't care about the open and close price, I should care more about the entire range for the day. The day's high and low, and also the open price.

Yes. The market doesn’t move in a straight line from open to close. But I believe that the close is the most informative as all the daily information has been incorporated into the price.
 
upload_2020-3-31_17-6-42.png


These are the last 5 years ^SPX close.
Over 1 and 5 days it’s mostly a 50/50 gamble.
But when you zoom in you can see trends anyway.
 
Hello everyone,
I did a lot more statistical analysis (I like this term a lot better than technical analysis. Is it the same thing?)... and I would like to share my results and get feedback. I hope I can explain clearly enough so that people can follow along.

I have daily data of S&P from 1/1/2000. This time, I took 3 numbers from each day. The open, the high, and the low. Then, I made ratios of high/open and low/open. This gave me the maximum percent gain and loss throughout that day. (Side note: I do notice the problem that I'm trading 24hour futures, while this data is only normal market hours. I don't know how to account for this yet).

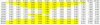
So once I had those two ratios, I made a table with the columns as the TP limit, and the rows as the SL limit. I set the variables (column headings) for TP as 0.1%, 0.2%, 0.3%, 0.4%, 0.5%, 0.6%, 0.7%, 0.8%, 0.9%, 1%, 2%, 3%, and 4%. The variables (row labels) for the SL were the same but opposite (-0.1%, -0.2%, etc.).

I calculated the odds of the following four scenarios happening for each combination of variables.
-The TP being hit that day, but not the SL. (100% weighting)
-Both TP and SL being hit (50% weighting)
-The TP not being hit, and the SL being hit (0% weighting)
-Neither being hit. (variable weighting that I don't feel like describing how I did, but it has to do with the odds of it being hit the next day, which reverts back to the first 3 items in this list).

I did these for each box in the table. The "weighting" I described above is for the further calculations.

I multiplied the odds of each box by the weighting. This gave me the odds that this trade would hit the TP before the SL.

Then, I multiplied by how much I would profit if I won. This gave me the expected profit per trade. The results are somewhat surprising.

The best trade is to set a 0.7%TP and a 3%SL. You would be expect to gain 4.81% on each trade (this accounts for the 10x leverage).

In the attached table, you'll notice that the labels of the columns and rows are 10x higher than I said. This accounts for the 10x leverage.

I still haven't accounted for weighting stronger for recent data. I need to rest and then think of how to do that.

I also realize that it's foolish to look at this blindly without considering current market conditions. That's how I could end up losing 7 "50/50" trades in a row yesterday.
 

Attachments

  • trade profit.jpg
    trade profit.jpg
    164.9 KB · Views: 8
Last edited:
if you lose 2 percent you need to make 4 percent to get back

If you lose 1 percent than need 2 to come back.

Etc

take this into account

Focus much more payoff space(expectation) space versus probability(frequency) space.
Also you need to factor in a betting method that optimizes your long term growth rate.
Surely you don’t want to deploy too much capital and capital deployment must vary dynamically as you lose money and make money otherwise you’ll go bust even with odds in your favor. Few methods. A good one called kelly criterion.

and be careful of overfitting Models to historical data
 
Last edited:
What else is there to build models on other than historical data?
All I know for sure is that you don’t want to build a model that replicates only your historical data. Learn more as I am to understand it deeply. My two cents. Take it or leave it.
 
Back
Top