House of If You Can Draw A Straight Line

Status
Not open for further replies.
Around 4420 then?

Depends on how long price takes to get there, since the channel's diagonal. I'm looking at around 4500. Which seems like a lot, but we could do it in two days the way things have been going lately.

Doesn't pay to hold a strong bias, though.
 
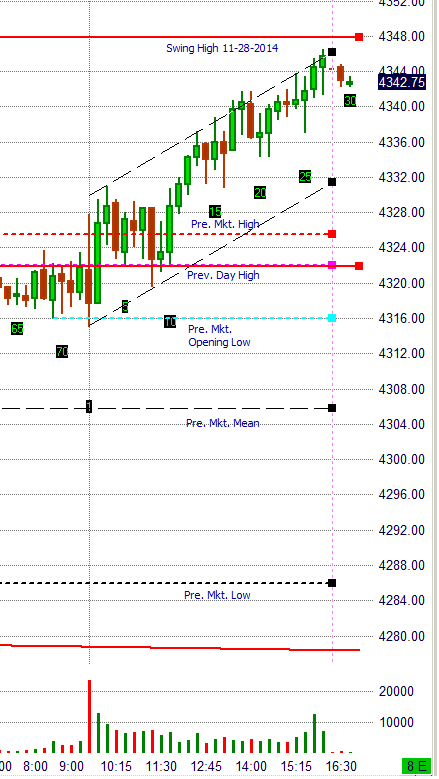
Today's 15 minute chart for NQ. I keep my channels, and diagonal lines to a minimum. Almost made it to my profit target of 4347.

Schaefer

PS: DB, please let me know, if I'm cluttering your thread.

02122015%2015%20Minute_zpsmbf8zvy3.png

This is fine. Very simple. And you got what mattered: 22. Otherwise I'm glad to see something in a larger bar interval. I'm sure others will note that it's far easier to see the stride in a larger interval, which keeps one from being tossed out over trivialities.
 
I want to thank those of you who responded to my question about intraday trading. As you know, there are four prior journals. These were devoted to explaining and illustrating and answering questions. Even so, even those who actually read the material and worked with it still had problems. So I reversed the process with this journal, addressing principles only without regard to specifics. In that respect, it's been successful. But there are only so many principles -- the range, the channel, the retracement, the AMT context -- and there are only so many ways to illustrate them. At a certain point, either one gets it or one doesn't.

I've also been concerned about clutter. There are the trolls, of course, but there is also a lot of intraday chatter here, largely because there's no place else for it, and to those who aren't trading intraday, it's pretty much meaningless, and it's all hindsight by then anyway.

But if so many of you are trading this intraday, either for real or in sim, then the intraday "clutter" is worth having. Just not here. So I'm going to reserve this journal for its original purpose -- though I really don't know what more to provide beyond the weekly chart showing where we are with regard to the upper and lower limits of it and any future changes in trend direction -- and start a new thread in the Trading forum specifically for trading the SLA/AMT intraday. In this way, those who are trading or trying to trade this intraday can point stuff out to each other without feeling that their posts are off-topic.

If it flies, fine. If not, that's fine too. God knows I've started plenty of threads that went nowhere.:)
 
Well. I didn't anticipate getting up here so fast. But that's the market for you, the scamp. At this level, we could reach the upper limit of the channel on Tuesday. Then pull back. Then endure all the posts and threads about how the bull market is over. Again. (Which is why the market continues to go up.)

upload_2015-2-14_6-29-47.png
 
At this level, we could reach the upper limit of the channel on Tuesday. Then pull back. Then endure all the posts and threads about how the bull market is over. Again. (Which is why the market continues to go up.)
View attachment 149395

That's the wonderful thing about opinion and trading. One can have all kinds of opinions yet the trading signals keep one's head straight. Markets do take time to change stride and so far upward mobility has been the norm. Price is consistently heading up. What I do wonder is the possibility that we might get to experience a climax run eventually. That would be a sight to behold.

Gringo
 
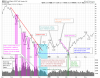
I wrote this stuff a few years ago focusing on volume. Price isn't as nicely analyzed as I now see some hindsight bias. So, don't kill me for making errors here. Nonetheless, it sheds another light onto a recent market bottom.

index.php


Note:
If I recall correctly, even though the analysis may have looked awesome at that time I couldn't read price properly. The scales had not yet lifted. Going back I checked and realized that even though I could walk and talk almost exactly the same as if I understood it well, the ability to read price was still absent.

That itself is a scary thought because it takes something more to cross that barrier of reading price in real time than reading it in hindsight. Those who are in the know at times can pick these discrepancies but for someone who is still learning this may look like an analysis from a guru, which it wasn't.

The learner don't generally have the eyes to spot flaws and can falsely continue to believe in the awesomeness of their own or someone else's ability. This leads to a conundrum of sorts as to how to distinguish real from the unreal. I don't have an answer to that other than doing one's own work and testing.

The only way to improve then is to work on one's analysis and testing and hopefully the epiphany happens. Trading using demand/supply and pure price isn't for everyone, and though simple once the barrier is crossed, looks confusing, abstract, and concocted. The magic comes with work and luck and there's no other way around the work.

Gringo
 

Attachments

  • QQQ Climax 2008 Bottom.png
    QQQ Climax 2008 Bottom.png
    41.9 KB · Views: 296
Last edited:
Price isn't as nicely analyzed as I now see some hindsight bias.

Hindsight is a wonderful thing. And the smart guys get their hindsight in first.

I'll also point out the Volume thread at TL. I go into all this preliminary support/fake climax thing there.
 
Status
Not open for further replies.
Back
Top