House of If You Can Draw A Straight Line

Status
Not open for further replies.
DB question ..

if one waits for a break of 4258 and waits for a retr. to enter a short ,
could it be that if price reverses at 4255 ish (50%) .. one is actually shorting into a reversal ?

or is it still worth to take the risk ? based on your view on such situations ?
 
DB question ..

if one waits for a break of 4258 and waits for a retr. to enter a short ,
could it be that if price reverses at 4255 ish (50%) .. one is actually shorting into a reversal ?

or is it still worth to take the risk ? based on your view on such situations ?

All of that is up to the individual trader. It's impossible for me to say what risk is worth taking for somebody else.

But then that's not what this journal is about, which is principles, not specifics. For the latter, there are four other journals to consult.

If you were to start your own journal, I might be able to answer your questions.
 
All of that is up to the individual trader. It's impossible for me to say what risk is worth taking for somebody else.

But then that's not what this journal is about, which is principles, not specifics. For the latter, there are four other journals to consult.

If you were to start your own journal, I might be able to answer your questions.


ok , point taken was just curious .. nvm
 
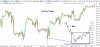
One of the problems that I have with drawing these charts is that Investing.com seems to disregard data when it wants to. The hourly chart that I have does not allow such a neat channel.

I have attached a chart with the section of the hourly from the end of January onwards, along with a 1 min chart from after the open on the 2nd Feb, for the section that is missing. The bottom trend line would be very different if that was included. Its hard to know which data to trust.
 

Attachments

  • Hourly Chart.jpg
    Hourly Chart.jpg
    100 KB · Views: 70
Status
Not open for further replies.
Back
Top