
Can we explore the idea that its not about not understanding what I'm looking at, but rather of what to do about it and when?While I appreciate the kind thoughts, your "biggest problem", again, is that you don't understand what you're looking at because you can't stop trading long enough to study it. This is a personal choice, and while I have tons of sympathy, I don't want to spend any more time in this journal on it.
All but a handful of "traders" on this site fail because they can't stop focusing on the money. And until they stop focusing on the money and begin to learn something about their business, they will continue to fail. That, however, is the case in many fields other than trading.
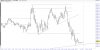
As an example, can we talk about this chart you just posted from the open yesterday? I had pretty much the exact same thing drawn. I'm not at home now, but I do have a copy of my 5 sec chart saved so I'm not going just from memory, and so from the open, we had a solid rejection of 74, at the level that you indicate as resistance. We did try down twice first, bouncing off 70 to go higher, but when we bounced off 74, we might have been able to get into a short just below this level.
So in real time, I'm seeing the rejection of 74. Of course it only took about 15 seconds to break higher, but initially, the rejection was there, no? Now perhaps you are watching the TQ and can see that there isn't much to this rejection, or perhaps you're seeing the "quality" of the rejection, or perhaps you're not wanting to short until we make a try to get below 67/68 level marked at support. Since I also know that you said in a few places where you mostly just trade RETs, you're waiting for a bounce from 74 and then a RET which never came, we just broke up higher.
But I guess I just ask this because if we just forget about what I may or may not have done with reference to trading, I wonder where the entry is. Not the SLA entry, because on this one minute chart, that first RET doesn't happen till about 95, and although that entry does work for a few points, it is much too late and much of the move has been missed.
I do fully understand about watching price in real time, seeing that right tick move. I make reference to a 5 sec chart because for this amateur, this 5 sec chart provides the so called "footprints" of that behavior (even in replay, I'm seeing that price doesn't move exactly the same way even with tick data, but the 5 sec chart seems appropriately good for seeing the footprints in my opinion).
Anyway, so given this chart that you post, can you elaborate on what you would do about the fact that there is the initial rejection off 74 to go lower, for only 2 points though, then the thrust higher, and then no looking back once we broke about 74. The SLA entry is not here, but there is obviously a trade to go long in here.
Last edited:

 ops
ops