House of If You Can Draw A Straight Line

Status
Not open for further replies.
I'd say this is where AMT comes in. Where does someone playing for ticks buy and sell versus someone looking to make money in chunks. Or potentially make money in chunks. Who's buying/selling what price levels? Where do you think those levels are?

I think this makes total sense... but once traders decide on a new mean, and hence the channel changes, then it has to be because enough people wanted to push price there and create a new mean, which means that eventually the big money has to buy at a level that before would indicate selling.

On a side note.. I don't want to muddy Db's thread here, so I started a new one. If anyone wants to continue this chat, lets do so here: (if Db doesn't mind of course... then we can just let this one die)

http://www.elitetrader.com/et/index.php?threads/talking-about-behavior-in-trading-the-nq.288869/
 
First, when you say to study the price activity, I wonder if you can put into words what this entails ... Watching it in real time, watching that right tick move on the price scale, this certainly gives you a sense of this behavior.

It means very intently watching that little tick move and do it with an eye toward discovering how price behaves before it drops from a high or rallies from a low or as it pauses or pulls back from a breakout and how it resumes its trend. I know that what you want from me is a schematic or recipe or model or a checklist or blueprint that shows what a failure and reversal look like before the failure, I just don't have it to give. I'd share it if I had it, but trading by price is a learned skill not a set of rote exercises. I didn't get it from DbPhoenix. DbPhoenix told me what to do to get it, and so that's what I did.

The only thing I can say that might help get the point across is this: You must watch price and make your task not "how can I make a profit and avoid a loss." You must seriously make it your goal first to understand what it is doing now, at this very minute. Then, why is it changing its behavior here? Then how can I put together what I learned about what price is doing and how it changes so that I can learn to anticipate those changes. Only after you can do that does it make any sense to think you have a chance of making a profit from anticipating those changes. By behavior think trending, ranging, thrusting, drifting, marching, dribbling - come up with whatever vocabulary helps you describe and understand what you are seeing.

You had mentioned in my journal that I probably don't know what you're at when you're looking for this change and hence if you could elaborate, I'd very much appreciate this. A tick chart moves far too quickly ... and yet when looking at a ... a one minute bar ... this behavior IMHO is los... so I wonder ...about what you think is sufficient for showing this behavior if you aren't watching live and hence looking for this behavior on a static chart.

Watch it live or live simulated replay. It is the only way, imo. On a live chart, I can watch a 5 minute bar and as long as it shows the last tick nub on the side, I'm good to go.

Second question refers to your point about who is buying. How can you determine this and why do you say it matters?

You learn to determine this by very intently watching price unfold in real time or through live simulated market replay. It matters because you make money by teaming up with high quality traders, not low quality trader. Poor demand was evident when I posted here yesterday in post #244 that I suspected a new leg down was commencing.

I have an idea on how maybe I can illustrate this. I'll post it later.
 
But, imo, from what I have read here in the journal section of ET, once someone latches on to the notion of a pattern, they put a barrier between themselves and the actual price activity by limiting in their mind what a reversal "looks" like. And once they do that, they will, possibly forever, miss the small little signs of waning demand or dwindling supply that always occur at reversal, even when this that or the other pattern is absent. It Furthermore, by focusing on the pattern, and not the behavior within the pattern, they will likely also miss the signs that the pattern itself is going to fail. Absent the pattern, all else appears to be mere "noise." I'm not saying there is not "noise" within price action, but if there is, it is far, far less than most assume. Price is telling a story, and every tick is a word, which is part of a sentence, which is part of a paragraph ... you can see where I'm going with this.

I don't want to go into any detail here because we've gone into this so many times before. However, having posted those charts yesterday, I want to call attention to the fact that I used the word "equilibrium" rather than "hinge", even in those instances where a hinge was being formed, because I wanted to emphasize the behavior rather than the pattern.

Wyckoff had no use for patterns and was pretty derisive about them (they were becoming quite popular at that time). But when he sought to focus on those areas where price was finding equilibrium, i.e., ranging, he said, off-handedly, that this behavior often resulted in a coil or triangle or "hinge" (it can also go on in rectangle form for an interminable amount of time). But the pattern was irrelevant. What mattered was that price was seeking equilibrium, or, in modern parlance, value. To focus on the "hinge" is to ignore what's going on, and if one doesn't focus on what's going on, he isn't going to know what to do about it when the dynamic changes, i.e., when price is done farting around and wants to make a move.
 
I don't want to go into any detail here because we've gone into this so many times before. However, having posted those charts yesterday, I want to call attention to the fact that I used the word "equilibrium" rather than "hinge", even in those instances where a hinge was being formed, because I wanted to emphasize the behavior rather than the pattern.

Wyckoff had no use for patterns and was pretty derisive about them (they were becoming quite popular at that time). But when he sought to focus on those areas where price was finding equilibrium, i.e., ranging, he said, off-handedly, that this behavior often resulted in a coil or triangle or "hinge" (it can also go on in rectangle form for an interminable amount of time). But the pattern was irrelevant. What mattered was that price was seeking equilibrium, or, in modern parlance, value. To focus on the "hinge" is to ignore what's going on, and if one doesn't focus on what's going on, he isn't going to know what to do about it when the dynamic changes, i.e., when price is done farting around and wants to make a move.
DB, You may have responded to a similar question in the past, but I have not found it. It is
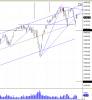
when there is a reasonable channel with a discernible midpoint, is it a reasonable expectation that a new channel can be established from that mid point to the previous channel midpoint as suggested in the attachment?
 

Attachments

  • sun1.11.png
    sun1.11.png
    32.1 KB · Views: 118
I don't know what all those lines are for, but if you change the upper and lower limits every time price breaks one or the other, you'll never get an oversold or overbought reading.
 
DB, You may have responded to a similar question in the past, but I have not found it. It is
when there is a reasonable channel with a discernible midpoint, is it a reasonable expectation that a new channel can be established from that mid point to the previous channel midpoint as suggested in the attachment?

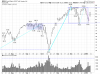
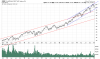
This isn't NQ but I am posting what I have marked on QQQ Daily. Price is in the median around 103 making this an area potentially turbulent. If price can't make it all the way up we might have a drop towards the lower channel on the weekly.

This isn't the area for me to trade but I am alert as this movement could be a large hinge based on how one looks at it. The main point to note is that price is in an equilibrium for now. There is enough space between the top and bottom to trade the middle if one wants to.

index.php


index.php


Gringo
 

Attachments

  • QQQ Daily.png
    QQQ Daily.png
    21.4 KB · Views: 283
  • QQQ Weekly.png
    QQQ Weekly.png
    23.6 KB · Views: 287
Last edited:
This isn't NQ but I am posting what I have marked on QQQ Daily. Gringo

Your weekly QQQ looks an awful lot like my weekly NDX :)... though I don't have a volume pane on mine. Eerie:eek:. You would almost think that AMT is somehow objective, and that different people might actually be able to come to the same conclusions about price and trend independently from one another:rolleyes:.
 
Status
Not open for further replies.
Back
Top