
You are using an out of date browser. It may not display this or other websites correctly.
You should upgrade or use an alternative browser.
You should upgrade or use an alternative browser.
House of If You Can Draw A Straight Line
- Thread starter dbphoenix
- Start date
- Status
- Not open for further replies.


Does anyone else see copyright violation here. I mean everyone's trying to copy my SLA method now. Some people just can't come up with something better on their own.
http://www.elitetrader.com/et/index.php?posts/4058941/
Gringo
http://www.elitetrader.com/et/index.php?posts/4058941/
Gringo
Shame these trending days don't happen more often! My entry was exactly where you mark your RET, so at 47.25.
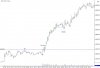
What I see on my chart when just looking at the 1 minute is a TDTDB lower down actually. In real time, it could have appeared to be a double top at 72, but this would be a double top in the middle of nowhere, and when price did break the support that I have drawn in at 67.50, no RET for a short would set up. Then once we cleared the range, a RET appeared for another long above 75.
Just like Gringo said not too long ago, it really is amazing how simple this could be if you just follow the rules and have the proper trader's mindset.
Thanks for the continued updates Db.
What I see on my chart when just looking at the 1 minute is a TDTDB lower down actually. In real time, it could have appeared to be a double top at 72, but this would be a double top in the middle of nowhere, and when price did break the support that I have drawn in at 67.50, no RET for a short would set up. Then once we cleared the range, a RET appeared for another long above 75.
Just like Gringo said not too long ago, it really is amazing how simple this could be if you just follow the rules and have the proper trader's mindset.
Thanks for the continued updates Db.
Attachments
- Status
- Not open for further replies.