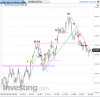
This is my attempt:
1. Breakout of the TR. Green dot would be a TR breakout long in this chart and if zoomed in a tick chart a micro pause- retracement after the breakout.
2. Break of the DL
3. SLA short trade
4. Test of the previous TR upper boundary and failure to breach it
5. Break of the SL. Long trade at the test-failure to breach
6. SLA long trade
7. Test of prior SH. DT
8. Break of the DL but after the DB (pink horizontal line)-HL there is an entry at green dot and DL is fanned.
9. Breakout of the DT-prior SH
10. Micro springboard
11. Break of DL
12. SLA short entry (although I would be vigilant to see reaction at level of prior DT (horizontal pink line at 7)
After that level fails to hold (17950) there are two possible entries marked with red dots.
Thanks indeed Db

1. Breakout of the TR. Green dot would be a TR breakout long in this chart and if zoomed in a tick chart a micro pause- retracement after the breakout.
2. Break of the DL
3. SLA short trade
4. Test of the previous TR upper boundary and failure to breach it
5. Break of the SL. Long trade at the test-failure to breach
6. SLA long trade
7. Test of prior SH. DT
8. Break of the DL but after the DB (pink horizontal line)-HL there is an entry at green dot and DL is fanned.
9. Breakout of the DT-prior SH
10. Micro springboard
11. Break of DL
12. SLA short entry (although I would be vigilant to see reaction at level of prior DT (horizontal pink line at 7)
After that level fails to hold (17950) there are two possible entries marked with red dots.
Thanks indeed Db