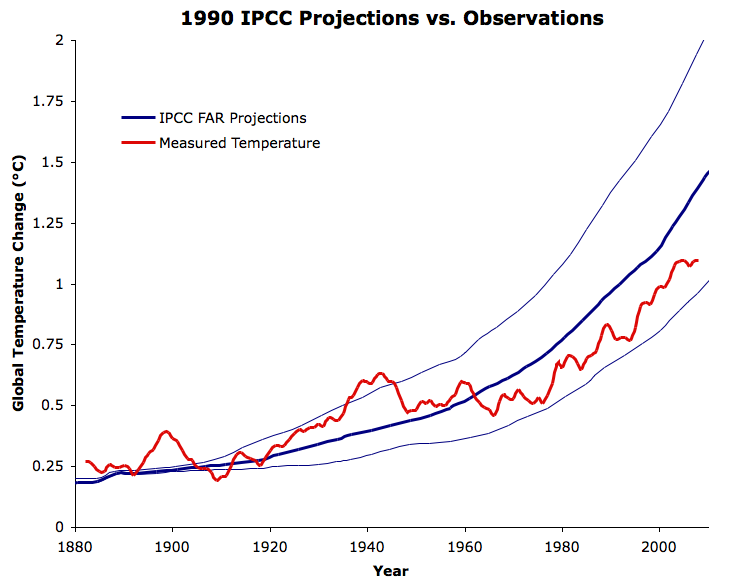
no one had to delete data to prove the models are failing. anyone who looks at the projections can see they projected big temperature rises... and there has been very little to no rise the last 20 years depending on the data set you look at. its a known by everyone but trolls.
here is the second chart... you can see the 95.7th percentile. If you understood the argument you tried to make... you realize that is the lower band for the models projections.
Beyond that... that is model failure even for agw nutter scientists.
http://www.globalwarming.org/2016/0...-warming-dr-christy-sets-the-record-straight/
Michaels and Knappenberger comment:
This is a devastating indictment of climate model performance. For periods of time longer than about 20 years, the observed trends from all data sources fall beneath the lower bound which contains 95 percent of all model trends and in the majority of cases, falls beneath even the absolute smallest trend found in any of the 102 climate model runs.
One other very encouraging result, using the satellite and balloon data, is that the observed trends are very flat, meaning that they are constant, neither increasing nor decreasing depending upon length of record. Greenhouse physics actually predicts this, so what we are seeing may very well in fact be the greenhouse-gas-generated response, not random noise. It is simply that the rate of warming is far beneath what has been forecast.
----
http://www.globalwarming.org/2016/0...-warming-dr-christy-sets-the-record-straight/
"Although not specifically mentioned in the video, some “consensus” scientists claim that in Figure 1, Christy’s choice of 1979 as the baseline year makes the divergence between models and observations
look bigger than if some other baseline–such as the average temperature during 1981-2000–were used.
That is certainly the case, but the criticism is both disingenuous and irrelevant. It is disingenuous because it suggests the 1979 baseline was conveniently chosen to obtain a particular result. Not so. Christy chose 1979 because it is the start of the satellite record. Making 1979 the baseline year allows for easy comparison of model projections and observations over the full length of the 37-year satellite record.
The criticism is irrelevant because, Christy explains, “The issue here is the rate of warming of the bulk atmosphere, i.e. the trend.” As noted, the satellites on average predict a warming rate that is about 250% faster than the observed rate. To illustrate the divergence in warming rates, Christy’s Figure 3 shows only the trend lines without the inter-annual variations due to non-greenhouse gas factors. “This is analogous to plotting the overall average speed of a runner along the course even though they likely ran slower on an uphill, and faster on a downhill.”[/QUOTE]