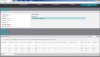
I ran a backtest to see how SPY performs in the 4th quarter. The results show for holding 1, 2 or 3 months when purchasing SPY on the last day in September. Results are certainly bullish!
The backtest can be run at the link below (can also be modified to include additional conditions).
http://www.fasterbull.com/members/strategy-builder.php?id=864
thanks
fan27
The backtest can be run at the link below (can also be modified to include additional conditions).
http://www.fasterbull.com/members/strategy-builder.php?id=864
thanks
fan27