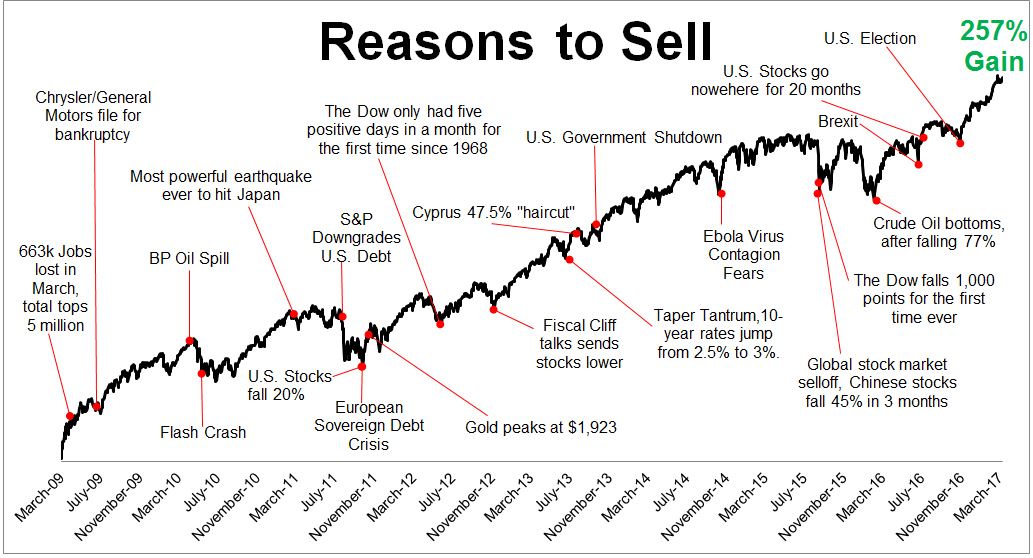
And what a streak it was! Longest streak of not having a 1% down day in nearly 1/4 century, and just the second in nearly half a century. For us longs, the cup runneth over. The last time we experienced a down day like this was Oct. 12. We were all over it in my thread of Oct. 11, here...
https://www.elitetrader.com/et/threads/big-day-for-tech-analysis-triangle-broken.303505/
when I posed the question "Will this be a double- bottom just below 18000, and then off to the races? Or will we break below that support level to correction territory?" The answer was the former, in resounding fashion. I followed that up with this "Breaking News" thread on Oct. 13...
https://www.elitetrader.com/et/thre...-triangle-broke-now-the-support-broke.303558/
The support broke briefly that morning, the first day of the historic run, and ultimately reversed and became the beginning of the upward trendline that we longs have enjoyed for the past 5 1/2 months. Maverick74 is still waiting for someone to deliver him the "breaking news". Meanwhile, many of us in the discussion saw the enormity of the time period in the markets, and were ready to pounce on it. Triangle patterns are not to be ignored. Neither are double-bottoms that ultimately hold.
So the record run is now history. The truth is the market has been slowly breaking down since March 1. However, who would've thought after the higher open yesterday that by the close it would be the streak-ending day? Interestingly, the Nasdaq, which closed down 107, actually hit an all-time high in the morning. The market can and will turn on a dime.
I see more turbulence ahead in the near term, but I have no interest in going short the market at this time. (Maverick74, I'm still weeks away from taking a short position in the market. Hope that's OK with you.) What I AM interested in is when the April rally will begin. Some years it's middle April, some years it's early April. It could be the difference of a few percentage points, so maybe some technicians out here can nail it. Also, sometime following the April rally would be a corrective phase. It began 3 consecutive May 1sts earlier this decade. Sometimes it doesn't happen until June, like last year. Maybe some technicians here will have a view on that as well. I realize it may be too early to gauge it, but feel free to post on this thread if and when your tech analysis reveals a shift or signal. My ability in this area is limited to seeing trendlines, triangles, and gaps in charts. I'll post when I see them, as I have done before.
For the record and for starters, noted chartist Sandy Jadeja is very concerned about market volatility to the downside coming May 11. He saw a smaller signal for March 13. Perhaps correct but a little off with the date on the March signal. You can read the article here:
http://www.marketwatch.com/story/cr...o-14800-and-todays-a-date-to-watch-2017-03-13
Please stick to technical analysis in this thread. Best wishes for successful trading to all!
https://www.elitetrader.com/et/threads/big-day-for-tech-analysis-triangle-broken.303505/
when I posed the question "Will this be a double- bottom just below 18000, and then off to the races? Or will we break below that support level to correction territory?" The answer was the former, in resounding fashion. I followed that up with this "Breaking News" thread on Oct. 13...
https://www.elitetrader.com/et/thre...-triangle-broke-now-the-support-broke.303558/
The support broke briefly that morning, the first day of the historic run, and ultimately reversed and became the beginning of the upward trendline that we longs have enjoyed for the past 5 1/2 months. Maverick74 is still waiting for someone to deliver him the "breaking news". Meanwhile, many of us in the discussion saw the enormity of the time period in the markets, and were ready to pounce on it. Triangle patterns are not to be ignored. Neither are double-bottoms that ultimately hold.
So the record run is now history. The truth is the market has been slowly breaking down since March 1. However, who would've thought after the higher open yesterday that by the close it would be the streak-ending day? Interestingly, the Nasdaq, which closed down 107, actually hit an all-time high in the morning. The market can and will turn on a dime.
I see more turbulence ahead in the near term, but I have no interest in going short the market at this time. (Maverick74, I'm still weeks away from taking a short position in the market. Hope that's OK with you.) What I AM interested in is when the April rally will begin. Some years it's middle April, some years it's early April. It could be the difference of a few percentage points, so maybe some technicians out here can nail it. Also, sometime following the April rally would be a corrective phase. It began 3 consecutive May 1sts earlier this decade. Sometimes it doesn't happen until June, like last year. Maybe some technicians here will have a view on that as well. I realize it may be too early to gauge it, but feel free to post on this thread if and when your tech analysis reveals a shift or signal. My ability in this area is limited to seeing trendlines, triangles, and gaps in charts. I'll post when I see them, as I have done before.
For the record and for starters, noted chartist Sandy Jadeja is very concerned about market volatility to the downside coming May 11. He saw a smaller signal for March 13. Perhaps correct but a little off with the date on the March signal. You can read the article here:
http://www.marketwatch.com/story/cr...o-14800-and-todays-a-date-to-watch-2017-03-13
Please stick to technical analysis in this thread. Best wishes for successful trading to all!


 Barry RitholtzVerified account@ritholtz