
I day trade futures with a fully automated system.
In trading it is generally considered that risking 1% or lower of your account per trade is low risk. 1% to 2% medium risk and anything over 2% high risk.
To grow my account aggressively I will be risking 4% of my account per trade.
My back testing goes back more than 10 years.
But for the purposes of illustration I have selected the lowest performing three back to back calendar years (2013/2014/2015) from the longer period back test.
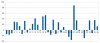
I have shown the 36 monthly percentage returns for this period in the bar chart below.
Looking at the chart you will see that the largest losing month during the period 2013 to 2015 was -36%. And the largest profitable month was +88%. Remember this is with 4% risked per trade and the period shown is only subset of my full backtesting results.

Yearly returns:
2013: +120%
2014: +204%
2015: +48%
Largest drawdowns in each year:
2013: -55%
2014: -40%
2015: -56%
Yes the drawdowns are deep. But if we are aiming for very high rewards then we will normally have to take very high risks. And it is worth pointing out that If we have a 50% drawdown then we need to make 100% just to get back to even.
I would say that overall the yearly risk/reward (MAR) ratio possible with day trading is very good, day trading beats other types of trading like long term trend following in this regard.
However the disadvantage is that day trading is much less scalable, especially if you want to diversify by trading some of the less liquid markets. So in the long run, when day trading, you can not compound 100+% yearly returns for decades (or even one decade) because sooner rather than later you will hit liquidity limits.
System stats for the period (2013-2015)
Number of trades: 532
%Profitable trades: 36%
%Profitable months : 50%
%Profitable quarters: 75%
In trading it is generally considered that risking 1% or lower of your account per trade is low risk. 1% to 2% medium risk and anything over 2% high risk.
To grow my account aggressively I will be risking 4% of my account per trade.
My back testing goes back more than 10 years.
But for the purposes of illustration I have selected the lowest performing three back to back calendar years (2013/2014/2015) from the longer period back test.
I have shown the 36 monthly percentage returns for this period in the bar chart below.
Looking at the chart you will see that the largest losing month during the period 2013 to 2015 was -36%. And the largest profitable month was +88%. Remember this is with 4% risked per trade and the period shown is only subset of my full backtesting results.
Yearly returns:
2013: +120%
2014: +204%
2015: +48%
Largest drawdowns in each year:
2013: -55%
2014: -40%
2015: -56%
Yes the drawdowns are deep. But if we are aiming for very high rewards then we will normally have to take very high risks. And it is worth pointing out that If we have a 50% drawdown then we need to make 100% just to get back to even.
I would say that overall the yearly risk/reward (MAR) ratio possible with day trading is very good, day trading beats other types of trading like long term trend following in this regard.
However the disadvantage is that day trading is much less scalable, especially if you want to diversify by trading some of the less liquid markets. So in the long run, when day trading, you can not compound 100+% yearly returns for decades (or even one decade) because sooner rather than later you will hit liquidity limits.
System stats for the period (2013-2015)
Number of trades: 532
%Profitable trades: 36%
%Profitable months : 50%
%Profitable quarters: 75%
Attachments
Last edited:

