Heads up on inflation

upload_2021-5-15_14-22-59.png

Do you think word has gotten out?
 
Last edited:
Christ that chart spans 20 years!

Take a look at the following. $GOVT is a US T Bond ETF. This is the 2-year chart. You can see the flight to bonds when CV hit, and a rotation out once they got it (somewhat) under control. We're back to 2019 pre-covid levels for T Bond demand.

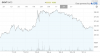
Also check out the CPI chart (Source: Bloomberg)

So maybe we'll hear some hawkish language from Uncle Jerome at the June Fed meeting?
 

Attachments

  • 975D6A2F-5D52-47B1-9EA6-64E85FE46675.png
    975D6A2F-5D52-47B1-9EA6-64E85FE46675.png
    199.1 KB · Views: 36
It means that if you’re positioned for expecting inflation, you’re in the herd.
Excellent answer... thank you.

EDIT: Really excellent. An hour later and I'm still noodling on your comment.
 
Last edited:
Back
Top