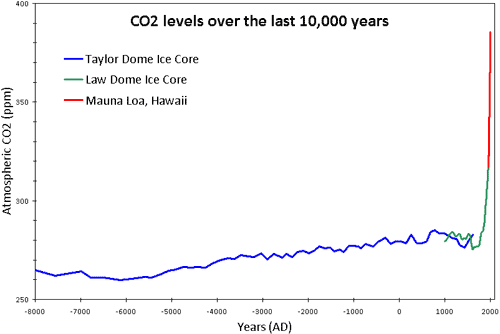
name one lie you lying piece shit how dare you call me a liar. You have never pointed out one lie.
1. since if you moron leftist lying brain can see that the purple line is co2 levels. so you lied by calling me a liar... see the second chart below. there is your proof we are at historically low levels.
2. Now tell me... if the the data were not proxy data... who was using thermometers 1000 years ago. (so you lied again calling me a liar.)
3. you of course know were were coming out of glacial period or ice age 10,000 years ago. You would know this if you had a real degree in science. so you lied again.
4. and finally here is the proof that change in ocean temps lead change in co2 levels...
so don't ever call me a liar again you drone.... troll.
http://www.sciencedirect.com/science/article/pii/S0921818112001658
Abstract
Using data series on atmospheric carbon dioxide and global temperatures we investigate the phase relation (leads/lags) between these for the period January 1980 to December 2011.
Ice cores show atmospheric CO2 variations to lag behind atmospheric temperature changes on a century to millennium scale, but modern temperature is expected to lag changes in atmospheric CO2, as the atmospheric temperature increase since about 1975 generally is assumed to be caused by the modern increase in CO2. In our analysis we use eight well-known datasets; 1) globally averaged well-mixed marine boundary layer CO2 data, 2) HadCRUT3 surface air temperature data, 3) GISS surface air temperature data, 4) NCDC surface air temperature data, 5) HadSST2 sea surface data, 6) UAH lower troposphere temperature data series, 7) CDIAC data on release of anthropogene CO2, and 8) GWP data on volcanic eruptions. Annual cycles are present in all datasets except 7) and 8), and to remove the influence of these we analyze 12-month averaged data. We find a high degree of co-variation between all data series except 7) and 8), but with changes in CO2 always lagging changes in temperature.
The maximum positive correlation between CO2 and temperature is found for CO2 lagging 11–12 months in relation to global sea surface temperature, 9.5-10 months to global surface air temperature, and about 9 months to global lower troposphere temperature. The correlation between changes in ocean temperatures and atmospheric CO2 is high, but do not explain all observed changes.
for once in your cheap life admit the truth.
You know change in co2 levels follows but lags change in ocean temps.
I have shown you the charts and the papers many times.
If that is a lie... I will stop posting...