I wanted to start posting old school charts to show how far back we can find people using the ambush trade (although most of them did not know they were). For the first one I chose to go back to the stock market crash during the Great Depression. To do this within TOS you have to open the 'Prophet' chart because TOS charts don't have enough data.
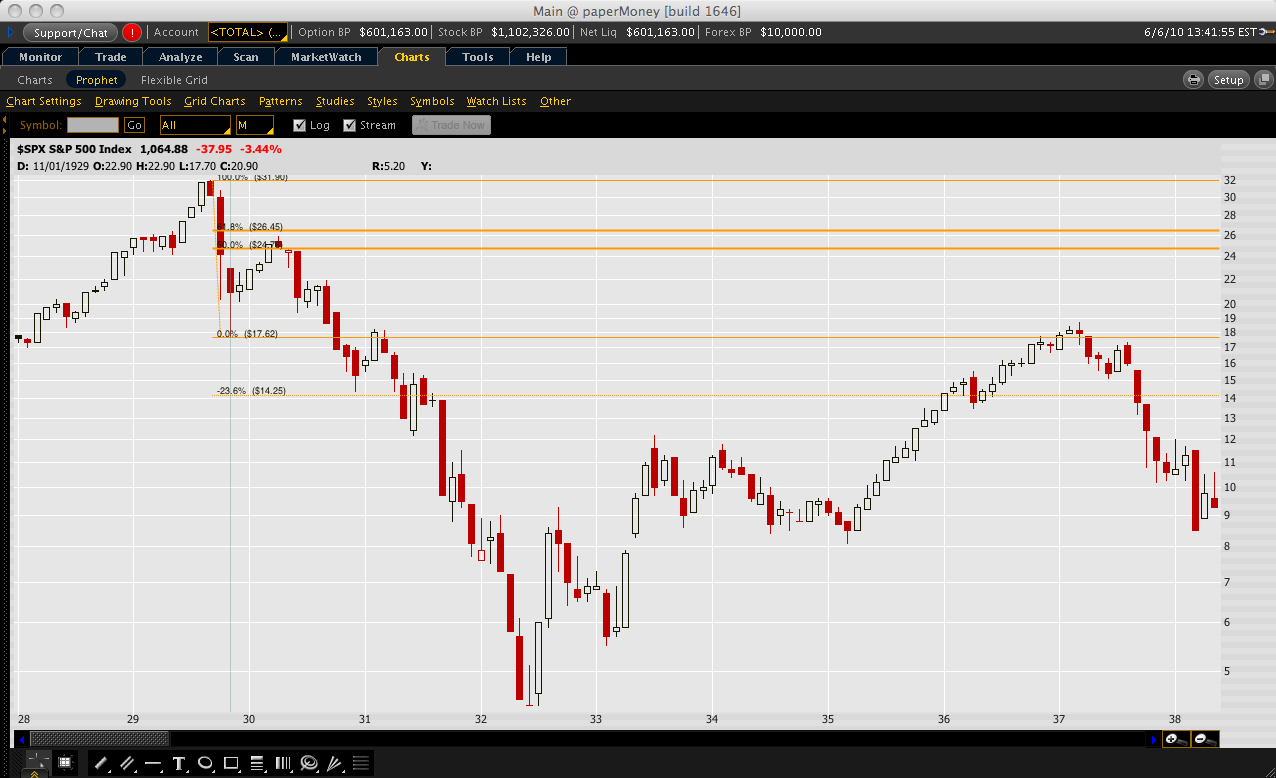
The first one is drawn from 31.90 highs to 17.70 lows. The ambush short was at 24.76 and the target was 14.25.
Here is the monthly chart:
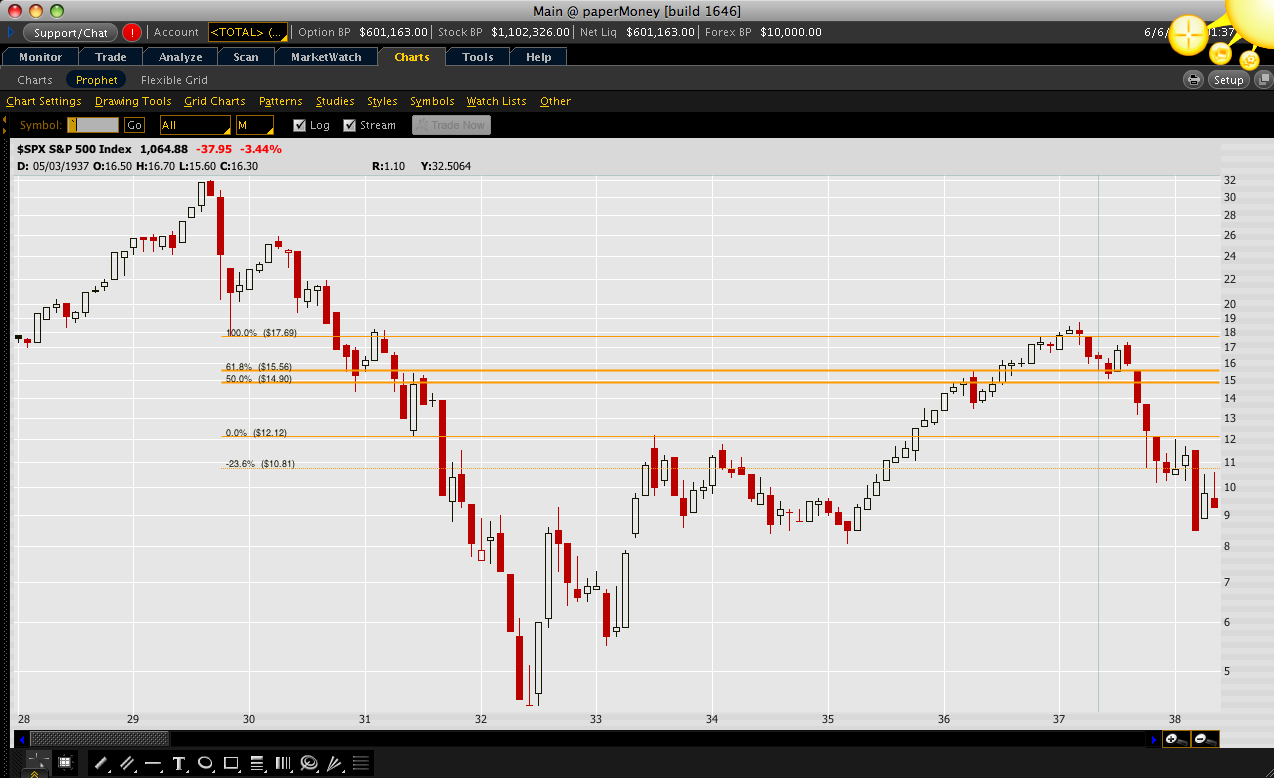
The second one is an extension because the first blew out its -23.6% target. The extension is drawn from 17.70 lows to 12.20 lows. The ambush short was at 14.90 and the target was 10.81.
Here is the monthly chart:
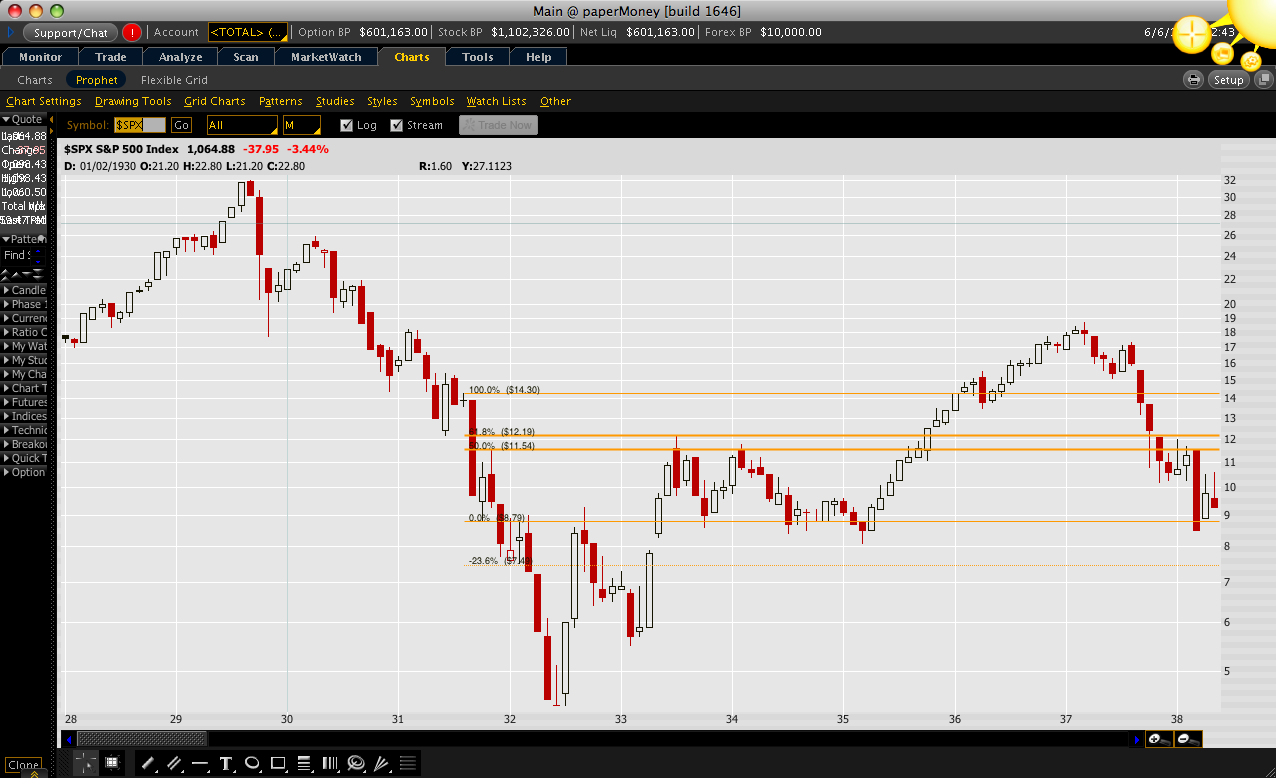
The third one is another ambush short after the second extension failed. It is drawn from 14.30 highs to 8.79 lows. The ambush short was at 11.54 and the target was 7.49
Here it the montly chart:
The first one is drawn from 31.90 highs to 17.70 lows. The ambush short was at 24.76 and the target was 14.25.
Here is the monthly chart:
The second one is an extension because the first blew out its -23.6% target. The extension is drawn from 17.70 lows to 12.20 lows. The ambush short was at 14.90 and the target was 10.81.
Here is the monthly chart:
The third one is another ambush short after the second extension failed. It is drawn from 14.30 highs to 8.79 lows. The ambush short was at 11.54 and the target was 7.49
Here it the montly chart: