
Looking for a retest of 200 day MA

You are using an out of date browser. It may not display this or other websites correctly.
You should upgrade or use an alternative browser.
You should upgrade or use an alternative browser.
Gotta love ZERO Risk Short SP 500 = $$$$
- Thread starter Spectre2007
- Start date

Looking for a retest of 200 day MA
200 day simple moving average ?
That is a massive run

200 day simple moving average ?
That is a massive run
This crisis is old news.. Media is fanning it in collusion with Banksters. It's to set fear high so the week hands dump inventory.
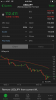
SPX 15% correction from the top.
If be greedy when others are fearful in an instrument that is solid is a good suggestion, the time to buy is now or near.
If be greedy when others are fearful in an instrument that is solid is a good suggestion, the time to buy is now or near.
$INDU chart leading the SPX: Weekly bars, 50 SMA falling, price below the 200 SMA [make sure your chart has 4+ years of data for that], RSI diverging from price since Q1 2013, lower high on high volume Q2/Q3 2015... I wouldn't be long in my retirement account, nope...
$INDU chart leading the SPX: Weekly bars, 50 SMA falling, price below the 200 SMA [make sure your chart has 4+ years of data for that], RSI diverging from price since Q1 2013, lower high on high volume Q2/Q3 2015... I wouldn't be long in my retirement account, nope...
According to my research, MAs used like that have no predictive value.
I bought ES futures today, market is at support and extended from my EMA of choice, expect current monthly bar to considerably snap beyond 1900s.
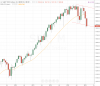
I bought ES futures today, market is at support and extended from my EMA of choice, expect current monthly bar to considerably snap beyond 1900s.
View attachment 161822
i agree with your analysis