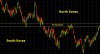
I predict 400 in SPX before the down trend line takes us lower, Powell to help break 386 wednesdey

You are using an out of date browser. It may not display this or other websites correctly.
You should upgrade or use an alternative browser.
You should upgrade or use an alternative browser.
Gotta love ZERO RISK in the SP500 = $$$
- Thread starter makloda
- Start date

Mr. Ackman is shitting the bed again.
Mr. W. appears to be saying that the effect proves there was no cause, genius.
Last edited:
I predict 400 in SPX before the down trend line takes us lower, Powell to help break 386 wednesdey
Do you have a Wednesday prediction? Fed minutes release will be what 3-weeks old at this point, so they could sound more Hawkish than perhaps their current view.


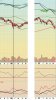
2008 crash technicals vs. now (spy)
Market tried to puke twice but it was a dry heave.
What are the red and black divergent lines in the bottom right panel?

What are the red and black divergent lines in the bottom right panel?
The ADX indicator which I have never found to be useful but it doesn't stop me from putting it at the bottom of my charts, just in case.........
*edit - the black line is some kind of trend indicator. If the line is falling it's considered a ranging price action, and vice versa.
Only real takeaway I got from this exercise was this year's top looks similar to the one in 08, just scaled up significantly.
Gonna be a truly epic, I mean yuuuuuge crash, if the analog plays out.
I've always wondered what immovable rock stops the irrestible force of muppets chasing price to these "obvious" fronts