explaining in precise words and with facts what it is you mean
Tiddlywinks, I’m very interested and would appreciate if you provided a little more information on your volume/volatility measurements as well.
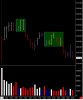
To start, lets recall the CONTEXT of yesterdays RTH session. Specifically, the opening and into the golden hour(s). Attached is my 5 minute ES chart of this time.
Recall, the market gapped down about 90 handles, and proceeded to retrace approximately 1/3 or about 30 handles directly out of opening bell. Notice the volume, past the opening bar was declining which is "normal", but remained sustained at an elevated level. Elevated in terms of range volatility which I'll present in a moment.
If you look at the bars, you can clearly see there was a lot of back and forth bar-to-bar, with the volatility range (price range) of preceding bars being retraced... IOW, pairs of bars were quite similar in volatility without a lot of gain and perhaps a lot of pain (depending on your trade risk appetite.)
You will also see I highlighted what is called lateral movement. There are 2 of these cases, encompassing 12 bars... that's 1 full hour between the open and 9am PST that basically went nowhere afai concerned... but with the still elevated (but nominally declining) volume. FWIW, my posts yesterday were made surrounding these lateral movements.
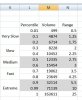
As mentioned, price range, price movement (per bar) is directly related to volume. Attached is a percentile table of the last 1600 ES RTH price bars, about 20 trading days worth including this day. It is clear as bar volume increases, price range (bar volatility) also increases! Think about the last 20 trading days... think about how the market moved during the period. It is reflected in this table. How will the table be affected if more days like current are brought in?
Two points in conclusion...
1) there was more bar range volatility than sustained directional volatility during the time in focus. Hence my mention of chop. Directional moves were tame and lame given the bar ranges and sustained (but declining) level of volume.
2) Including non-rth data to construct the percentiles would be like extrapolating the number of bird species in the amazon rain forest based on bird watching at your local picnic park. For me, RTH and non-RTH require separate analysis regarding volume, volatility, and price movement.
HTH

")