This is option expiration week i think. Typically an up week.
You are using an out of date browser. It may not display this or other websites correctly.
You should upgrade or use an alternative browser.
You should upgrade or use an alternative browser.
Gotta love ZERO RISK in the SP500 = $$$
- Thread starter makloda
- Start date
yes with greece over and done with and chinas markets now being propped up with tens of billions of dollars the only focus now is on earnings, its unbelievable that this whole greece and china scare lasted 3 weeks, has anyone noticed that in todays new markets downturns last only days maybe weeks, there is no such thing as months or years, corrections and bailouts get fixed within hours, it didn't take long for china to halt trading on numerous companies and print billions of dollars to create this buying opportunity and end any further drop in their markets......amazing to see such markets trade in such a matter.
So now with earnings at focus I think we could say new historical highs coming by mid to end of july for all indexes.....
Reversions happen much faster, too. There is no "ride" on the way up. imho...It's like a bear market reversal. Still, I am somewhat optimistic for the election season. FED is holding back on Christmas presents.
Wondering how many people opened positions today while stocks are up 5-15% in the last 3 to 4 trading days....I only sell on up days, sold off all TNA today and over 50% of my XIV position.....
DOW LOW JULY 7th was 17465
Todays close 17977
up 500 points 5 days, most of those gains though happened since THURSDAY afternoon
17548 close on Thursday afternoon July 9th
monday afternoon dow closes at 17,977
429 dow points in 2 days
17,977.68
 217.27(1.22%) 4:03PM
Prices
Date Open High Low Close Volume Adj Close*
Jul 10, 2015 17,561.12 17,797.49 17,561.12 17,760.41 85,800,000 17,760.41
Jul 9, 2015 17,530.38 17,764.85 17,530.38 17,548.62 100,520,000 17,548.62
Jul 8, 2015 17,759.01 17,759.01 17,496.22 17,515.42 69,830,000 17,515.42
Jul 7, 2015 17,684.92 17,793.45 17,465.68 17,776.91 105,840,000 17,776.91
DOW LOW JULY 7th was 17465
Todays close 17977
up 500 points 5 days, most of those gains though happened since THURSDAY afternoon
17548 close on Thursday afternoon July 9th
monday afternoon dow closes at 17,977
429 dow points in 2 days
17,977.68
Prices
Date Open High Low Close Volume Adj Close*
Jul 10, 2015 17,561.12 17,797.49 17,561.12 17,760.41 85,800,000 17,760.41
Jul 9, 2015 17,530.38 17,764.85 17,530.38 17,548.62 100,520,000 17,548.62
Jul 8, 2015 17,759.01 17,759.01 17,496.22 17,515.42 69,830,000 17,515.42
Jul 7, 2015 17,684.92 17,793.45 17,465.68 17,776.91 105,840,000 17,776.91
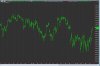
That is why selling when bear market or a correction starts is not easy. You always have a hope that next day it will go higher but after 5 months when look at the chart, you would ask yourself how come I did not see that correction coming?So what do we see here in this 120 minute chart. Just looking at this chart, I would say we are in a down trend, and this is a lower high. That's what it looks like right now.
We are in a downtrend if it fails to make a new high past 2120. With earnings in front of us, do you think that won't happen?
2120 is also my decisive point.