Sorry that came out wrong, i was same.Ouch. I was a broker dealer with my own trading business as a floor market maker. I only used Redi to layoff risk and pairs trade.

You are using an out of date browser. It may not display this or other websites correctly.
You should upgrade or use an alternative browser.
You should upgrade or use an alternative browser.
Goldman mulls collapse in gasoline demand
- Thread starter Michael J. Fletcher
- Start date
That's all we need is a fake science lecture from a liberal troll.People are driving more.
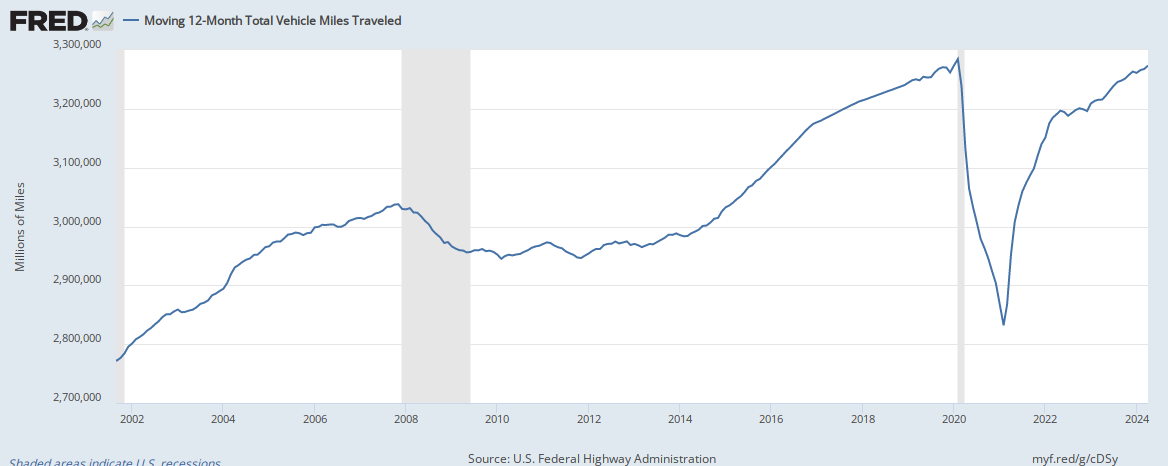
We can blame global warming for the decrease in gasoline demand. We know that as the temperature rises, liquids expand. As explained here, : Science Clarified: "The behavior of gasoline pumped on a hot day provides an example of liquid thermal expansion in response to an increase in temperature. When it comes from its underground tank at the gas station, the gasoline is relatively cool, but it will warm when sitting in the tank of an already warm car. If the car's tank is filled and the vehicle left to sit in the sun—in other words, if the car is not driven after the tank is filled—the gasoline might very well expand in volume faster than the fuel tank, overflowing onto the pavement."
See that, warmer temperatures, aka global warming, is causing more gasoline to magically appear in the tank and thus cause people to purchase less and less of it.

Robert Morse
Sponsor
That's all we need is a fake science lecture from a liberal troll.
Wow. I just read that.

...If the car's tank is filled and the vehicle left to sit in the sun—in other words, if the car is not driven after the tank is filled—the gasoline might very well expand in volume faster than the fuel tank, overflowing onto the pavement."
...
Fascinating. I've been driving a variety of older and newer cars over the many years of my driving career, and have never seen this happen. Once. Ever. (And I fill to the brimmy brim brim of my car's chinny-chin chin if gasoline is cheep and I think I am buying gas during a price lull.) That statement in the quote is hypothesis, not applied.
P.S. There are a lot of other variables in that statement that are not considered as factual, such as the fact that a car's gas tank is usually shielded from sun, considering where it is located...Or what happens when you pump warmer insulated gas from an underground tank into your car which has suffered a sudden cold snap-shift of 30-50 degrees at equinox change-over, in the past 24-48 hours. It happens in temperate zones you know.
P.P.S. That sort of thing is gong to happen in the next 48 hours here in New England, by the way. High today was 57 degrees. Projected low for early Saturday morning? 10 degrees. So there we are.
Last edited:
Wow. I just read that.
I just read it too.
A couple points.
1) I had no idea the St Louis Fed kept track of this stuff.
2) I went to the interactive chart and in 2010 people drove 2.9 M miles, in Nov 2016 that number was 3.2M miles. 300,000 mile difference. Divide that by 30 avg mpg.... and you get an extra 10,000 gallons more per year.
So BFD when you consider the weekly unleaded build/draw fluctuates between -5 M gallons and +5M gallons per week. That chart is deceptive to those conditioned to looking at stock charts... the graduation of the Y axis is key.
ONE of these is 10,000 gallons:
3) RRY... you gotta be the grouchiest fucker in the world. U Crack me up.

Last edited:
Robert Morse
Sponsor
I just read it too.
A couple points.
1) I had no idea the St Louis Fed kept track of this stuff.
2) I went to the interactive chart and in 2010 people drove 2.9 M miles, in Nov 2016 that number was 3.2M miles. 300,000 mile difference. Divide that by 30 avg mpg.... and you get an extra 10,000 gallons more per year.
So BFD when you consider the weekly unleaded build/draw fluctuates between -5 M gallons and +5M gallons per week. That chart is deceptive to those conditioned to looking at stock charts... the graduation of the Y axis is key.
3) RRY... you gotta be the grouchiest fucker in the world. U Crack me up.
BTW, I read it, but don't believe it.
Anyone who knows anything knows global warming will decrease under Trump as airplanes are no longer allowed to fly here from 7 countries, no more junkers coming in from Mexico....and the friggin Canadians are going to quit driving down for "holiday".BTW, I read it, but don't believe it.


There is smth weird going on in crude and products... The cumulative build in the past few weeks has been YUGE. And yet, there's no visible dent. Moreover, spec long positioning is the highest I can recall and keeps going. All very strange.
I will now put on my conspiracy theory hat!

US is preparing for big Middle Eastern war....
stockpiling oil...
stock piling on VIX calls...
blocking Middle Eastern immigrants...
we better buy some as well.......
- conspiracy theory hat off -

I will now put on my conspiracy theory hat!
US is preparing for big Middle Eastern war....
stockpiling oil...
stock piling on VIX calls...
blocking Middle Eastern immigrants...
we better buy some as well.......
- conspiracy theory hat off -
I'll take it one further...( this one is gonna probably gonna get Zandy carted off to some gulag in Siberia tonight...)
But I'm serious here. Trump has been ordering certain websites off the air.... https://www.google.com/search?q=trump+taking+down+websites&ie=utf-8&oe=utf-8
I just went to the link that shows the inventory of the Strategic Petroleum Reserve, which I actually looked at recently (last fall).... and its gone.
Here's the main link. Notice the inventory link doesn't work. https://energy.gov/fe/services/petr...um-reserve/spr-quick-facts-and-faqs#Inventory