You are using an out of date browser. It may not display this or other websites correctly.
You should upgrade or use an alternative browser.
You should upgrade or use an alternative browser.
Gold
- Thread starter KGTrader4
- Start date
Do have a position on GLD. It is my best performing ETF or stock for that matter. When I saw it, it had already moved. Huge volume spike. broke out of a trading range, wide ranging green candlesticks. All telling me to buy. I bought in the very next day. There are multiple stocks that could have the same chart patterns. WYNN is the one trade I missed out on. It would have been a huge winner. I saw it when it was in the 60s, would have been stopped out after that huge run up to the 100s but, still would have been a very nice winner. Keep your eyes open. There are a lot of opportunities in the stockmarket. You just need to know what you are looking for.
Watching UNG and CS. Both are headed down. However, both are near the bottom. It may take a week, 2 weeks or longer for these stocks to breakout and go much higher but, there is no hurry. One of these trading gems just waiting for you to pick it up when the time comes. We are not willy nilly, buying in just because it is cheap in dollar amount. It could get even cheaper. Hell, CS could go down to $0.50 before it finds bottom and starts moving up as I noted in another thread. Patience, patience and more patience. Good things come to those who wait.
Here’s my take on this.
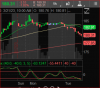
I would be looking to short GLD. The risk/re is prudent at the numbers as follows:
I would short if it pulls back below ~181.5 using looks like 184 as a stop. Tgt would be 170. 4:1 r/r. The follow through if this were to happen, I have found is often times something like this… it migrates to whatever the 21ma is, on the daily, then bounces back to near 184, then continues down.
If gld goes to looks like 186? Then I look for the same thing. And I would be all over it if it does the fake breakout at all time highs. If it makes all time high, and trades below, entry is at 194.xx, tgt initially is 185 With 195 as stop.
I use hourly charts for entries into longer term holdings. My number 1 rule is not to be short if above the 50 ma, and not be long if below.
In this chart, the lighter yellow is a 50sma, the bold yellow is weighted 50. See the correlation, see the fake moves.
Best of luck!
Attachments
Last edited: