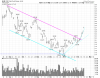
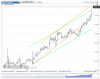
Gold futures have been moving fast. The TC had to be redrawn and price was falling out of the previous tighter channel easily. Price is now above the 1300 and clearly the strength is there. There isn't much to do if one wasn't already in. We keep an eye on it as price approaches the upper limits. These limits are only in our heads and price can head above them or drop as it pleases. We only use these channels for context. If a sell signal develops closer to the upper TC then a short might be initiated. This short is going to be less probable as compared to a from close to the bottom of the upward sloping TC.
Gold Hourly
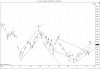
Daily chart also shows a persistent uptrend. The hourly looks a bit messy but so far the daily is contained.
Gringo
")