Gold, Silver, and Indexes Using Price Action

1. My questions

1) I trade with Interactive Broker's TWS and I use their data displayed in the free version of Multicharts platform for charting the NQ.

I get IB's free bundle, and I have not had to pay for anything additional.

I started out trading stocks in 2012, and moved to futures when I started studying DbPhoenix's "If You Can Draw a Straight Line" thread. I never traded forex.

2) I have all but retired completely from my former trade. My last "official day" was December 17, 2013. I did do 9 hours of work in my trade in the month of January. I am taking February off completely (I never did like working in the cold). I will keep working for certain long-time customers and their referrals, but I am no longer soliciting new work. If my work truck broke down tomorrow, I would retire completely lol. In other words, I no longer need to work my trade, but I still want to do it once in a while - after nearly 30 years, can you blame me? My best guess is I will still work 10-20 hours/month - down from 60 hours/week two years ago - during the Spring and Fall. I will not work so much in the summer (I never did like working in the heat and humidity), and not at all in the Winter.

3) For the most part, I trade reversals from support and resistance levels, using retraces on a single tick chart to decide to enter a trade. This makes me usually right for a few seconds or minutes, even when the trade goes against me in the end. I am quick to cut a loss or scratch a trade, as DbPhoenix says. I can't remember having more than 2 losses in a row. But that is because if I have two losses in a row, I stop trading until price goes somewhere else. Some days price doesn't give me another opportunity during the time I give it, so I finish in the red that day. There haven't been many, but there have been several losing days for me since August. Never like the size you mention. But I am not going to make 800K in profits this year either. I do not worry about the money and I do not worry whether a day is profit or loss. I just get up and do what DbPhoenix taught me to do.

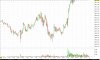
4) There are only three strategies - breakouts, retraces, and reversals - so it can't get too complicated I think - though I do see a lot of people try hard to make it complicated. My strategy is reversals. I mark the long term trend channel and its mean with the chart set to a daily bar interval, then switch the same chart window to an hourly bar interval and mark the support and resistance levels I see there, and then I change the bar interval to a 30 second bar interval and wait for 9:30 AM, and then I watch and wait. When price gets close to support or resistance, I switch to single tick chart. If price reverses and then retraces from support or resistance, I then wait to see if the reversal resumes. If it does, I trade it. If instead price "melts through support like a popsicle in July" I don't.

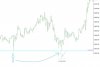
I do trade one "breakout" type strategy which I gave examples of in the old thread. This is a trade where I buy or sell a break of what I guess you could call the "opening range." I don't know if that is accurate, since from what I know of "opening range breakout" strategies most people seem to use a fixed time interval to define the range. I do not use a fixed time for the opening range - I let price set the opening range - whether it takes 30 seconds or 30 minutes - and then I trade the breakout of that range (this assumes that I am not already in a trade - for example, I was already long when 9:30 rolled around this morning, so there was no thought of looking for an opening range breakout trade). Before someone comes along and asks why I was long, look at the price action on a single tick chart at 8:55 EST and the seconds right after, and also figure out why 3451 had a horizontal line on my chart alerting me to get alert for a reversal - a cyan colored line :D. The single tick chart displays has a "picture perfect" reversal with retrace - I didn't get filled that low, but I got filled a few seconds from there. Happens everyday sometime between 8:30 AM and 10:00 AM EST. Most days, anyway. I guess I shouldn't say everyday. It just seems like everyday.

Everything I have been doing as far as day trading is the same as it has been since I started learning to trade the NQ emini futures with DbPhoenix's method.
 
Ok.. I will. I do hope that I am not a dumbass troll.. LOL... I have a running list in my journal of those people who are because sometimes the names are similar and I want to make sure whose posts I should read or just glance over.

1. My questions are more of a personal nature, hence why I wanted to PM you, but I certainly understand why you turned the PM off so I will ask here. Feel free to answer only some or none at all. I have already PMed dbphoenix and hence why I am working my way through the threads. I feel like I was being torn in different directions, not knowing what to focus on, and seeing your posts have inspired me. I keep watching stocks, then maybe think FOREX is a low cost way to start learning, and then I see these great threads on Futures, and so this is partly why I am torn.

First the dumbest question. I just opened up an IB account and I see you trade with IB as well. I'm in Canada and went with IB because the other broker I have up here does not have OCO orders. I had dreams of following the trading of a great thread on here by a guy named "geez" who put on trades and just walked away. He had a win rate of 50%, but used a profit:risk ratio of 2:1 so the statistics of it brought home the bacon.

Anyway, I noticed you said in one thread that you use a free platform and you get free data. I am a bit confused because IB will give you free data or charge only $10 a month if you don't do enough trades, but they also state that for CME Futures, floor based prices are $85. Does the free package included real time NQ quotes? I am currently getting a 5 or 10 minute delay which is just fine for learning, but will need real time of course for when I put money on the line. You'd be surprised how difficult this stuff is to google so when I came across your thread it really piqued my interest. My charts don't look anything like yours... are you using the IB data and order execution with another charting platform? (ie. your headers are all different and color schemes don't match, unless maybe you really personalized yours)

2. Since I am still on your posts from August/Sept 2013, this may already be answered, but were you able to quit by end of year as you wanted in your regular job?

3. Another great thread on here was from a guy named Lescor who finally sat down and figured it all out after losing for 8 years. He is doing more of an automated approach it seems, but still manages to pull in 300k to 800k a year. He does have some losing months though.. maybe 10k or 20k loss for the whole month, but then next month he may be up 50k or 60k so it doesn't worry him. He understands the nature of probability. So I wonder if you have a string of loses? I suspect that a hands on approach like watching price has a few bad trades but at the end of the day, those traders who know what they are doing end up positive. So perhaps 2 or 3 bad trades in a row might be just part of the random nature of outcomes, but if you have at least 5 or 6 trades a day then is it possible for every day to end up positive?

4. Are you still trading just the NQ and doing things as you have done them? I read db say somewhere that it gets more complicated then what is presented in the straight line threads, but if you can make $1000 a day doing what you are doing, I figure there is no need to fix something that isn't broken.

Hmmm.. I think that's it. I really kind of just wanted to talk to a someone who is real, someone who doesn't have the experience that db has, and to find out if you were having a lucky streak initially and hence if you have had to adapt in some way. Thanks for your time!


I am gonna bud in just because I have been where you are. I am not trying to get in the middle of your conversation with 40 :) .

You are have the wrong preocupations for someone who is learning. The broker is of no concern at this stage, just focus on learning, you can get access to real time quotes for free if that is what you want, and even replay for free with Ninja.

Now, if you wanna learn I guess you have come to the right place, 40 is living proof of that.
 
When price gets close to support or resistance, I switch to single tick chart. If price reverses and then retraces from support or resistance, I then wait to see if the reversal resumes. If it does, I trade it. If instead price "melts through support like a popsicle in July" I don't.

Wow.. thank you so much for such a detailed and honest reply! One quick follow up question if I may. You say you switch to a tick chart when price gets close to S/R. It is my understanding that IB doesn't supply tick data per say, more like snapshots of price in fractions of time. I'm not sure what Multicharts does with this data to display it as tick data, but I wanted to ask if you have any specifics about this? When you say a single tick chart, do you mean that each tick (transaction) is displayed as one bar and in this case doesn't the chart just scroll through the screen like crazy? I realize I'm getting ahead of myself here but I want to ask now while I have the opportunity!
 
I am gonna bud in just because I have been where you are. I am not trying to get in the middle of your conversation with 40 :) .

You are have the wrong preocupations for someone who is learning. The broker is of no concern at this stage, just focus on learning, you can get access to real time quotes for free if that is what you want, and even replay for free with Ninja.

Now, if you wanna learn I guess you have come to the right place, 40 is living proof of that.

Oh I totally agree Niko, but I figure when it all comes together I want to be ready... who knows.. it might be soon! I enjoy learning about other parts of this trading business, and often read articles just to give the brain a rest with studying. Going through pages of db's threads requires rest breaks and hence why I look into brokers or business news. 40's story really is quite inspirational and as you say, living proof.
 
Before someone comes along and asks why I was long, look at the price action on a single tick chart at 8:55 EST and the seconds right after, and also figure out why 3451 had a horizontal line on my chart alerting me to get alert for a reversal - a cyan colored line :D. The single tick chart displays has a "picture perfect" reversal with retrace - I didn't get filled that low, but I got filled a few seconds from there. Happens everyday sometime between 8:30 AM and 10:00 AM EST. Most days, anyway. I guess I shouldn't say everyday. It just seems like everyday.

My stab at this... showing a 30 second bar chart since I don't have access to tick data. It appears as if price already bounced off the 6:45 bar at 3451 and now at 7:55 it came down again.... so once it bounced off you went long since buyers were there to lift it higher... correct?

(I will start my own thread for NQ next week so my apologies to the original poster, I just wanted to clear up this last thing point before I stop making a mess of your thread!)
 

Attachments

  • nq - feb 6.jpg
    nq - feb 6.jpg
    144.5 KB · Views: 54
Here is what I was looking at: The main chart is the one minute bar interval. Below is what I was watching when I sent my buy order in. I know I posted a number of similar examples in the original straight line thread. If you see that little retrace on the tick chart, my trigger to buy was when price went above the little peak after the lower low and before the higher low.

I don't about all the rest of what you ask about. I have had no problems trading my plan using what I have shown here in this post and the other thread.
 

Attachments

  • Same old song and dance.jpg
    Same old song and dance.jpg
    92.6 KB · Views: 84
k p,

You look like a kid in a candy store.

Gringo

Nothing wrong with a bit of enthusiasm! I truly appreciate the time it takes for those who have figured it out to help those who are trying to get there. Sorry about hijacking your thread. :D
 
Gold April futures look to close above the hinge, but not the most robust breakout I've ever seen from a hinge. NUGT looks like it is starting to breakout of its own hinge.
 
Back
Top