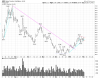
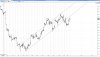
If one wants to incorporate trends and trend channels into his trading decisions, he has to begin at the beginning, in this case the end of August. One can draw the line and the channel wherever he likes, but if he doesn't do it properly, he is likely to be looking at/for the wrong thing at the wrong time.
In G's chart above, the more profitable strategy is to take the reversals at the extremes, most profitably the shorts in a downtrending channel. Yes the long reversals can be taken off the bottom of the channel, but they aren't as profitable because the channel slopes downward.
One can, of course, wait for price to exit the channel entirely, but this is a far more traumatic event, like having your bus route changed without warning. There will thus be a lot more back-and-fill and wandering around in the dark with a penlite trying to discern direction. This requires extra patience unless there is clear and undeniable evidence of reversion. Note in G's chart that price has not exited the channel but rather appears to be reversing at its upper extreme.
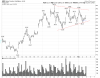
Ok, thanks. I understand that the drill here is to sell the top, but somehow my data showed me that the SL from aug is broken (not shown above, shown below) and therefore my reading was that buyers were struggling for control. They don't have it yet or else the RETs wouldn't be so deep, and they have not even been able to get to 50% of the downswing from October. For all I know, they can even fail to make a HH and price could just plunge back in the TC from aug.
But at the immediate moment I saw buyers trying, the fact that they are trying at the top of a longer TC adds context, thanks.
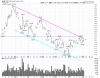
Now, I am currently only watching what happens around this TCs and therefore I am seeing them everywhere
 .
.