You are using an out of date browser. It may not display this or other websites correctly.
You should upgrade or use an alternative browser.
You should upgrade or use an alternative browser.
Goal in 2015: $92k to $150k
- Thread starter universaller
- Start date
IB report shows a slight difference in YTD return:

Still, I have been conservative holding on high yield stocks while reducing the exposure on options.

Little change on P&L since last update:

Ended the month almost flat (down -0.4%):

will be adding some capital to trade more actively:

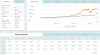
June and July were the worst months for portfolio - keeping on both oil and gold stocks, betting on earnings. Roughly, I lost 30% of total value. Since inception (Jan 2012), the below is the P&L comparison with S&P500 since I trade S&P500 stocks and options mainly:
Date ----------------------------- SPY --------------------- My account
Jan 2012 to Jul 2015 -------- +76.73% ----------------- +148.08%

Date ----------------------------- SPY --------------------- My account
Jan 2012 to Jul 2015 -------- +76.73% ----------------- +148.08%
This gives a little bit better information:

Lol, there's are traders out there with better records than buffett e.g.
Soros 30% plus for 30 yrs
Druckenmiller 30 % plus for 30 yrs
Peter Brandt 40% for 25 years
If one can say 30% for 30 years, he should make
1.3^30 = 2619.996 times.
40% for 25 years, he should make
1.4^25 = 4499.88 = 4500 times.
To compare those performances equally, let the length of investment be 50 years (from 30 to 80).
For 20%, 1.2^50 = 9100.438 (100K becomes 910M)
For 30%, 1.3^50 = 497929.2 (100K becomes 49792M)
For 40%, 1.4^50 = 20248916 (100K becomes 2024891M) which is bigger than small country's wealth
Note that stock market kept open for 400 years from Netherland. If there WAS any one with 20% outperformance trading logic, then he has all the wealth on earth NOW. Even Buffet and Gates should be broke now.
Therefore, I am sure no one HAD 20% logic for 400 years.