From what I can tell, the only rational explanation left for the warming of the earth and therefore the rise in sea levels, is the burning of fossil fuels. It is not the amount of energy reaching the earth, it is the amount of energy being trapped by the earth. The earth has become the ultimate roach motel: Energy can come in. But it can't get out.
This short article debunks most of the usual exogenous explanations given by deniers:
"Over the last 35 years the sun has shown a cooling trend. However global temperatures continue to increase. If the sun's energy is decreasing while the Earth is warming, then the sun can't be the main control of the temperature.
Figure 1 shows the trend in global temperature compared to changes in the amount of solar energy that hits the Earth. The sun's energy fluctuates on a cycle that's about 11 years long. The energy changes by about 0.1% on each cycle. If the Earth's temperature was controlled mainly by the sun,
then it should have cooled between 2000 and 2008.
 Figure 1: Annual global temperature change (thin light red) with 11 year moving average of temperature (thick dark red). Temperature from NASAGISS. AnnualTotal Solar Irradiance(thin light blue) with 11 year moving average ofTSI(thick dark blue).TSI from 1880 to 1978 from Krivova et al 2007.TSIfrom 1979 to 2015 from the World Radiation Center (see their PMOD index page for data updates). Plots of the most recent solar irradiance can be found at the Laboratory for Atmospheric and Space Physics LISIRD site.
The solar fluctuations since 1870 have contributed a maximum of 0.1 °C to temperature changes. In recent times the biggest solar fluctuation happened around 1960. But the fastest global warming started in 1980.
Figure 2 shows how much different factors have contributed recent warming. It compares the contributions from the sun, volcanoes, El Niño and greenhouse gases. The sun adds 0.02 to 0.1 °C. Volcanoes cool the Earth by 0.1-0.2 °C. Natural variability (like El Niño)heats or cools by about 0.1-0.2 °C.Greenhouse gases have heated the climate by over 0.8 °C.
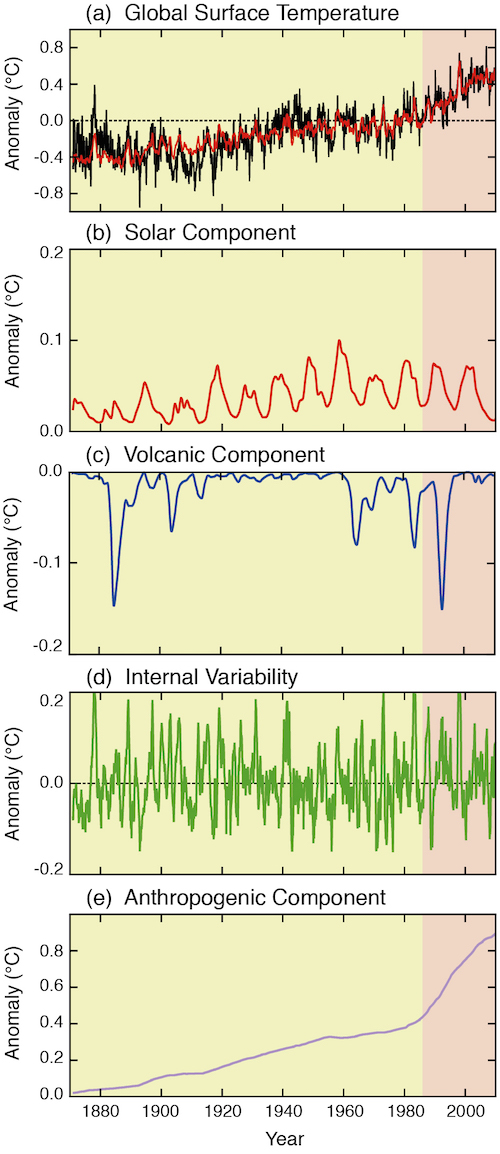
Figure 2 Global surface temperature anomalies from 1870 to 2010, and the natural (solar, volcanic, and internal) and anthropogenic factors that influence them. (a)Global surface temperature record (1870–2010) relative to the average global surface temperature for 1961–1990 (black line). A model of global surface temperature change (a: red line) produced using the sum of the impacts on temperature of natural (b, c, d) and anthropogenic factors (e). (b) Estimated temperature response to solar forcing. (c) Estimated temperature response to volcanic eruptions. (d) Estimated temperature variability due to internal variability, here related to theEl Niño-Southern Oscillation. (e) Estimated temperature response to anthropogenic forcing, consisting of a warming component from greenhouse gases, and a cooling component from most aerosols. (IPCC AR5, Chap 5)
Some people try to blame the sun for the current rise in temperatures by
cherry picking the data. They only show data from periods when sun and climate data track together. They draw a false conclusion by ignoring the last few decades when the data shows the opposite result.
Basic rebuttal written by Larry M, updated by Sarah
https://www.skepticalscience.com/solar-activity-sunspots-global-warming.htm
")
