Ghost of If You Can Draw A Straight Line

Status
Not open for further replies.
But, from where I sit, the battle lines are drawn. If am long, I am out if the bar I marked is broken, period. If it is, time to move on and reassess. The bar itself is not the focus, but the significance of the price it represents.

Agreed, that is the level I consider the battle line too.

I would exit a long (if I had a long) and look to initiate a short on a retest trigger.

I've been following the "If You Can Draw" threads since the "Son" thread and I just wanted to thank everyone for their contributions. Each post, whether "right" or "wrong" helps to further the discussion and lead to better analysis.

Looking forward to more great discussions and I will try and contribute when I can.

Thanks

 
Today offers a good example of when lines aren't going to do you much good. Instead you have to get into the minds of buyers and sellers and what they want and what they're afraid of. Perhaps most important, what are those who just bought now thinking?

If you were a buyer, what would you look for?

If you had bought today, what would you be thinking?

If questions are not just for 5m chart, i would give it a try: suppose i am trading 60m, what i would do is in the chart.
 

Attachments

  • 2-18-2014 3-56-16 PM  tomorrow.jpg
    2-18-2014 3-56-16 PM tomorrow.jpg
    229.5 KB · Views: 90
If you were a buyer, what would you look for?

If you had bought today, what would you be thinking?

Depends on when I'm asking this question. After the open we're quickly approaching the upper limit you mentioned. I know that other people know that it is there.

Market starts getting choppy on the smaller bar intervals. Demand lines drawn from the open low gets broken on higher bar intervals (like 5/15 min).

The indecision starts getting noticed on the 1 hr bars (that's where I first saw it personally). Suddenly, we're testing higher grounds, but the demand line from the open on the hourly seems to be in danger as well (here I had to zoom in to confirm whether I was seeing Ghosts or not).

After everyone have been silent for hours, catching their breaths, they start screaming. But it is like people got embarrassed for raising their voice, and they all get second thoughts.

Sure, it looks even worse after the 11:50 low gets broken, but had I been a buyer today then I would've been less and less optimistic throughout the session. What I would have looked for? These things I mentioned NOT to happen.
 
Today offers a good example of when lines aren't going to do you much good. Instead you have to get into the minds of buyers and sellers and what they want and what they're afraid of. Perhaps most important, what are those who just bought now thinking?

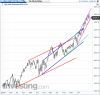
This is all taking place at the upper limit of the long-term trend channel (posted above):

attachment.php


After plunge and recovery, price formed a hinge, attempted to rally out of it, instead formed a double top, then dropped below the apex of the hinge.

If you were a buyer, what would you look for?

If you had bought today, what would you be thinking now?

attachment.php
 

Attachments

  • Image1.png
    Image1.png
    31.5 KB · Views: 224
This first chart -- the "swoop" chart -- was posted three weeks ago:

attachment.php


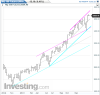
This second chart is an update and a zoom-in of the last two trend channels:

attachment.php


The mean of the current channel is about 3600. If we fall as much tomorrow as we did today, we'll be pretty much there. The lower limit of the channel is a little under 3500. Whether we then drop to the next trend channel back, the one beginning in Nov '12, is unknowable. But even if we don't, 200pts is fine.
 

Attachments

  • Imageb.png
    Imageb.png
    45.5 KB · Views: 197
  • Image3.png
    Image3.png
    35.5 KB · Views: 195
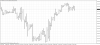
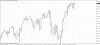
Seems like yesterday the big fellas from the daily completed their RET ( A DT actually), As of now (8:00-9:00) The entry is being triggered in the hourly. So as Db pointed out is either a downtrend below 73 or a scratch above it..
 

Attachments

  • ndmar14h1.png
    ndmar14h1.png
    34.3 KB · Views: 101
  • ndmar14daily.png
    ndmar14daily.png
    35.2 KB · Views: 90
After the entry we had a TR, then an attempt of buyers to BO to the upside and a failure, then we had a test of the MP of the morning TR and a BO to the downside with its respective RET. At the close the trend was down and it looks like a failure on the daily. Not a bullish context for monday. :)
 
Status
Not open for further replies.
Back
Top