
You are using an out of date browser. It may not display this or other websites correctly.
You should upgrade or use an alternative browser.
You should upgrade or use an alternative browser.
Ghost of If You Can Draw A Straight Line
- Thread starter dbphoenix
- Start date
- Status
- Not open for further replies.

From post 282: remember that the upper and lower limits of trend channels are determined not by swing highs and lows alone, or even primarily because of them, but by the extent to which price rises above and below the mean of the channel. Therefore, whatever trades are tethered to that mean should be included:
DB: if i understand correctly, the upper limit of the channel in the first chart is not correct, which should be the dashed line in 2nd chart. Then i am not sure how you get the mean of the channel--- the red line in the third chart. May you please explain how you draw the mean the red line in 3rd chart? Thank you very much.
DB: if i understand correctly, the upper limit of the channel in the first chart is not correct, which should be the dashed line in 2nd chart. Then i am not sure how you get the mean of the channel--- the red line in the third chart. May you please explain how you draw the mean the red line in 3rd chart? Thank you very much.

From post 282: remember that the upper and lower limits of trend channels are determined not by swing highs and lows alone, or even primarily because of them, but by the extent to which price rises above and below the mean of the channel. Therefore, whatever trades are tethered to that mean should be included:
DB: if i understand correctly, the upper limit of the channel in the first chart is not correct, which should be the dashed line in 2nd chart. Then i am not sure how you get the mean of the channel--- the red line in the third chart. May you please explain how you draw the mean the red line in 3rd chart? Thank you very much.
Attachments
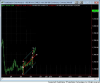
DB: Thanks a lot for your prompt response. Please correct me if i misunderstand what you are trying to tell me: Although the upper limit using 3 is similar to the upper limit in the 1st chart, but you are using the thought of the post 282 but not just a swing high:
remember that the upper and lower limits of trend channels are determined not by swing highs and lows alone, or even primarily because of them, but by the extent to which price rises above and below the mean of the channel. Therefore, whatever trades are tethered to that mean should be included:
After the trade in 3, price tried to move toward to the middle of the channel, therefore 3 should be included in the channel and drew the upper limit through 3. Once having upper and lower limits, just get the middle line of the channel---- the middle has the same distance to the upper limit and lower limit. There are many ways to get the middle line and you have shown one way to draw it.
Once we got the mean, we could get different upper and lower limits as two light dashed lines in chart 4 of post 282 using equidistant move from the mean as time goes by and if there is need. The mean is always the same unless price moves to a different mean of a new channel.
The essence I feel is in drawing the upper limit through 3 but not through 4 (through 4 will get us the dashed line in 2nd chart) based on the essence of a channel shown in the above in italics. For any channel, we could always first draw the upper limit using the definition as in 2nd chart because we draw based on what we know at that moment; sometimes it will still make sense as time goes by and when it does not make sense as in this example, we need to think of the meaning of the channel whose mean is the key and we have to get the mean and upper and lower limits using the thought in italics.
remember that the upper and lower limits of trend channels are determined not by swing highs and lows alone, or even primarily because of them, but by the extent to which price rises above and below the mean of the channel. Therefore, whatever trades are tethered to that mean should be included:
After the trade in 3, price tried to move toward to the middle of the channel, therefore 3 should be included in the channel and drew the upper limit through 3. Once having upper and lower limits, just get the middle line of the channel---- the middle has the same distance to the upper limit and lower limit. There are many ways to get the middle line and you have shown one way to draw it.
Once we got the mean, we could get different upper and lower limits as two light dashed lines in chart 4 of post 282 using equidistant move from the mean as time goes by and if there is need. The mean is always the same unless price moves to a different mean of a new channel.
The essence I feel is in drawing the upper limit through 3 but not through 4 (through 4 will get us the dashed line in 2nd chart) based on the essence of a channel shown in the above in italics. For any channel, we could always first draw the upper limit using the definition as in 2nd chart because we draw based on what we know at that moment; sometimes it will still make sense as time goes by and when it does not make sense as in this example, we need to think of the meaning of the channel whose mean is the key and we have to get the mean and upper and lower limits using the thought in italics.
Huyang,
Section 15 of Wyckoff's addresses this. In that section he states that trend lines may need to be moved to the next swing point to capture the markets "stride."
Notice in the chart DB posted, price lengthened its stride after point 2. To capture this change of the market, the supply line (top of the channel) was moved to the next swing high, point 4. In doing so, the mean also changes.
Section 15 of Wyckoff's addresses this. In that section he states that trend lines may need to be moved to the next swing point to capture the markets "stride."
Notice in the chart DB posted, price lengthened its stride after point 2. To capture this change of the market, the supply line (top of the channel) was moved to the next swing high, point 4. In doing so, the mean also changes.
Huyang,
Section 15 of Wyckoff's addresses this. In that section he states that trend lines may need to be moved to the next swing point to capture the markets "stride."
Notice in the chart DB posted, price lengthened its stride after point 2. To capture this change of the market, the supply line (top of the channel) was moved to the next swing high, point 4. In doing so, the mean also changes.
Your first post in six years. Thank you.
Huyang,
Section 15 of Wyckoff's addresses this. In that section he states that trend lines may need to be moved to the next swing point to capture the markets "stride."
1in10: Thank you very much for suggesting the specific section. I have started to read section 15.
Today offers a good example of when lines aren't going to do you much good. Instead you have to get into the minds of buyers and sellers and what they want and what they're afraid of. Perhaps most important, what are those who just bought now thinking?
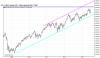
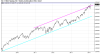
This is all taking place at the upper limit of the long-term trend channel (posted above):

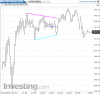
After plunge and recovery, price formed a hinge, attempted to rally out of it, instead formed a double top, then dropped below the apex of the hinge.
If you were a buyer, what would you look for?
If you had bought today, what would you be thinking?
This is all taking place at the upper limit of the long-term trend channel (posted above):
After plunge and recovery, price formed a hinge, attempted to rally out of it, instead formed a double top, then dropped below the apex of the hinge.
If you were a buyer, what would you look for?
If you had bought today, what would you be thinking?
Attachments
Today offers a good example of when lines aren't going to do you much good. Instead you have to get into the minds of buyers and sellers and what they want and what they're afraid of. Perhaps most important, what are those who just bought now thinking?
This is all taking place at the upper limit of the long-term trend channel (posted above):
After plunge and recovery, price formed a hinge, attempted to rally out of it, instead formed a double top, then dropped below the apex of the hinge.
If you were a buyer, what would you look for?
If you had bought today, what would you be thinking?
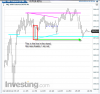
If you will indulge me a second post in six years, I'll play. Some may think that the price you got long should be a factor in the decision making process. For me, the decision is the same no matter where I got long.
As I look at this chart (I do not trade index futures), it would be easy to put in all kinds of fancy lines to justify hanging on to a long in "hopes" it will turn profitable. But, from where I sit, the battle lines are drawn. If am long, I am out if the bar I marked is broken, period. If it is, time to move on and reassess. The bar itself is not the focus, but the significance of the price it represents.
Attachments
- Status
- Not open for further replies.