
You are using an out of date browser. It may not display this or other websites correctly.
You should upgrade or use an alternative browser.
You should upgrade or use an alternative browser.
Ghost of If You Can Draw A Straight Line
- Thread starter dbphoenix
- Start date
- Status
- Not open for further replies.

Someone on another thread wanted to know if he'd drawn his trendlines correctly. I asked if he knew what the purpose of trendlines and trend channels were, but he never responded, so I'll post my reply here since this is the sort of thing we're working on in chat.
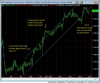
Here is his chart:

Those of you who've been following along will note that the trendline is correct, but the trend channel is not. The upper limit of the trend channel should start at the highest high between the two swing lows used to start the trendline:

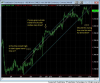
Note, however, that if this is done "the way it's supposed to be done", the upper limit of the trend channel passes straight through most prices and below a great many. Since trendlines and trend channels are supposed to track price, this makes no sense. Rather the upper limit must be raised to the next swing high, as it was in the first chart (accidentally, it seems). And lest this seem like curve-fitting, remember that the upper and lower limits of trend channels are determined not by swing highs and lows alone, or even primarily because of them, but by the extent to which price rises above and below the mean of the channel. Therefore, whatever trades are tethered to that mean should be included:

Note that a confirmation of this mean is suggested by the fact that price reached it -- the red dot -- by the end of the trading session on the 14th (the chart was posted by the originator before the end of the day). One could, if he were OCD enough, confirm all this mathematically, but it's easy enough to eyeball and sufficiently accurate for trading purposes, at least AMT purposes.
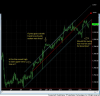
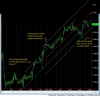
The question was also raised about using the "overbought" and "oversold" extensions to draw a trend channel. Though having the OB and OS information can be useful if one understands mean reversion, it isn't crucial that these extensions remain outside the trend channel. Either way, the mean doesn't change (other than by plotting error):

And if one extends these lines, he can project the next turning point in the ES (the focus of the original chart) to be around 1900, depending on how long it takes to get there (the line is diagonal, so the point value of it rises every day). Whether we ever do get there is unknowable; price may reverse at any time. However, some time ago I used this same procedure to forecast a turning point in the NQ at what was then 3680, and look where we are. By now, of course, the point value of the "end" of the upper limit of the trend channel is higher, due again to the fact that the line is diagonal. Right now the upper limit is at 3700+, depending on how quickly we get there, if we get there at all.
I'll reiterate here, again, that trendlines and the upper and lower limits of trend channels do not provide support and resistance. That's not their job. Trendlines show trend and potential trend change. That's it. Trend channels illustrate the extent to which traders depart from the mean of the channel. The mean is the anchor. Price excursions away from that mean are tethered to it until traders decide to find a new range. But those extensions do not in and of themselves provide "support" and "resistance", at least not as understood by most traders.
Here is his chart:
Those of you who've been following along will note that the trendline is correct, but the trend channel is not. The upper limit of the trend channel should start at the highest high between the two swing lows used to start the trendline:
Note, however, that if this is done "the way it's supposed to be done", the upper limit of the trend channel passes straight through most prices and below a great many. Since trendlines and trend channels are supposed to track price, this makes no sense. Rather the upper limit must be raised to the next swing high, as it was in the first chart (accidentally, it seems). And lest this seem like curve-fitting, remember that the upper and lower limits of trend channels are determined not by swing highs and lows alone, or even primarily because of them, but by the extent to which price rises above and below the mean of the channel. Therefore, whatever trades are tethered to that mean should be included:
Note that a confirmation of this mean is suggested by the fact that price reached it -- the red dot -- by the end of the trading session on the 14th (the chart was posted by the originator before the end of the day). One could, if he were OCD enough, confirm all this mathematically, but it's easy enough to eyeball and sufficiently accurate for trading purposes, at least AMT purposes.
The question was also raised about using the "overbought" and "oversold" extensions to draw a trend channel. Though having the OB and OS information can be useful if one understands mean reversion, it isn't crucial that these extensions remain outside the trend channel. Either way, the mean doesn't change (other than by plotting error):
And if one extends these lines, he can project the next turning point in the ES (the focus of the original chart) to be around 1900, depending on how long it takes to get there (the line is diagonal, so the point value of it rises every day). Whether we ever do get there is unknowable; price may reverse at any time. However, some time ago I used this same procedure to forecast a turning point in the NQ at what was then 3680, and look where we are. By now, of course, the point value of the "end" of the upper limit of the trend channel is higher, due again to the fact that the line is diagonal. Right now the upper limit is at 3700+, depending on how quickly we get there, if we get there at all.
I'll reiterate here, again, that trendlines and the upper and lower limits of trend channels do not provide support and resistance. That's not their job. Trendlines show trend and potential trend change. That's it. Trend channels illustrate the extent to which traders depart from the mean of the channel. The mean is the anchor. Price excursions away from that mean are tethered to it until traders decide to find a new range. But those extensions do not in and of themselves provide "support" and "resistance", at least not as understood by most traders.
Attachments
Db, Looking over Friday's action, we can see a possible triangle/hinge is angled upward. It appears that the midline of the hinge is also honored by price if it is angled as well. Is this something that has been discussed before on these sl threads. Usually we see charts of symmetrical hinges with horizontal midlines. The volume dropped off during the triangle formation to suggest it is a hinge.
http://www.elitetrader.com/vb/attachment.php?attachmentid=143226&stc=1&d=1392574469
http://www.elitetrader.com/vb/attachment.php?attachmentid=143226&stc=1&d=1392574469
Attachments
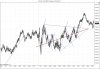

I would add that perhaps making things simpler, would make things simpler. Here's the same price behaviour is shown as just a break out and retracement. We can track demand and supply using the standard lines. The conclusion is the same but the confusion whether the funky hinge is, or isn't, is removed. This is going back to the straight line analysis. Focusing on price whether one can or cannot detect a hinge is still a viable strategy. Hinge is the icing on the cake, but is not the cake itself. It's is nice to be able to detect a hinge but not so when mental acrobatics need to be performed to identify it. It is of course my opinion and I am highly influenced by keeping it as simple as possible, hence, the focus on the straight lines.

We're all in it together and each person's view is valuable, and adds more depth to our understanding. At times though, when the well has been dug, and it has hit water, there isn't more need to dig deeper. The objective is to get to the water, and not dig just for the sake of digging.
Gringo
We're all in it together and each person's view is valuable, and adds more depth to our understanding. At times though, when the well has been dug, and it has hit water, there isn't more need to dig deeper. The objective is to get to the water, and not dig just for the sake of digging.
Gringo
Attachments
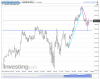
Db, Looking over Friday's action, we can see a possible triangle/hinge is angled upward. It appears that the midline of the hinge is also honored by price if it is angled as well. Is this something that has been discussed before on these sl threads. Usually we see charts of symmetrical hinges with horizontal midlines. The volume dropped off during the triangle formation to suggest it is a hinge.
A hinge results when price reaches equilibrium. Price cannot by definition reach equilibrium if it's angled upward.
If you're interested in hinges, I suggest you look for them without CVBs.
You might also want to remove all the lines from your charts.
I know this is not about the NQ, but..applying the SLA to Crude on the longer timeframe...,
I am hoping for a retracement in the overnight session, to take a short position.
Hope everyone is having a good weekend. I had some schoolwork that was needed to get done on thursday or friday so I was unable to physically be at the computer to press the button.
According to my post I was looking for a short, It did provide an entry at 9pmEST at 100.20-100.10, which would have been probably a 30-45 tick profit or scratch depending on if you decided to hold out to the bottom of the channel at 99, but if you are following the lines, when it decided not to make a new low at 8:30am on thursday the position should have been exited at no higher then 99.85 with a preferable exit at 99.75 .
A second short could have been taken around midnight on thursday night, however I would probably have been asleep...it was a valid setup as it broke the demand line and failed at the 50%.
A third trade is at 9am on friday morning... it stays inside the supply line.. although its 9am...and a lot of volatilty..hopefully one would have been filled around 100 for a short, this trade trends down for an hour before heading up again. Between a 40-50 tick profit on this one.
Red Arrows are Short entries...Green arrows are covers.
Its all well in hindsight of course... and DB if you have any objection to me posting CL here.
Attachments

Hope everyone is having a good weekend. I had some schoolwork that was needed to get done on thursday or friday so I was unable to physically be at the computer to press the button.
According to my post I was looking for a short, It did provide an entry at 9pmEST at 100.20-100.10, which would have been probably a 30-45 tick profit or scratch depending on if you decided to hold out to the bottom of the channel at 99, but if you are following the lines, when it decided not to make a new low at 8:30am on thursday the position should have been exited at no higher then 99.85 with a preferable exit at 99.75 .
A second short could have been taken around midnight on thursday night, however I would probably have been asleep...it was a valid setup as it broke the demand line and failed at the 50%.
A third trade is at 9am on friday morning... it stays inside the supply line.. although its 9am...and a lot of volatilty..hopefully one would have been filled around 100 for a short, this trade trends down for an hour before heading up again. Between a 40-50 tick profit on this one.
Red Arrows are Short entries...Green arrows are covers.
Its all well in hindsight of course... and DB if you have any objection to me posting CL here.
Clint,
Do you have a written plan already? If you do and you have backtested it then you dont need the hindsight trading, if you dont then you should put yourself into that. Take into account what Db said last week about oil, it will save you a lot of time.
Its all well in hindsight of course... and DB if you have any objection to me posting CL here.
No objection, if you're talking about trades you're going to take or trades that you took based on your trading plan. But given all the couldawouldashoulda, it's most likely just hindsight wishing, which is essentially masturbatory.
Aside from that, if you can tame CL, more power to you. But put together a trading plan first. Like Nik said.
But given all the couldawouldashoulda, it's most likely just hindsight wishing, which is essentially masturbatory.
Agree with this mostly. I'm in the process of putting a plan together. I did not have so much success with the short term intraday...mostly my own fault mentally, and getting my head all screwed up from over trading, not really the fault of following the SLA. So I have chosen to step back and trade from the 15/60minute charts to try and limit such mistakes.
So yes those trades were hindsight/CWS, however I want to build my plan from these trades.
Agree with this mostly. I'm in the process of putting a plan together. I did not have so much success with the short term intraday...mostly my own fault mentally, and getting my head all screwed up from over trading, not really the fault of following the SLA. So I have chosen to step back and trade from the 15/60minute charts to try and limit such mistakes.
So yes those trades were hindsight/CWS, however I want to build my plan from these trades.
There's always the possibility that you could develop a plan based on trades, but since you're skipping ahead, you will more likely spend much more time getting where you want to be than if you worked your way through the development of the plan as suggested. Gears has the right idea.
I suggest also that you open your own journal. Focus will very likely be an issue.
- Status
- Not open for further replies.