
You are using an out of date browser. It may not display this or other websites correctly.
You should upgrade or use an alternative browser.
You should upgrade or use an alternative browser.
Ghost of If You Can Draw A Straight Line
- Thread starter dbphoenix
- Start date
- Status
- Not open for further replies.
I've attached a pdf below of something I wrote several years ago on hinges. It may be helpful. Or not.
Thanks DbPhoenix. I remember having read that arc over at the other place. I don't think I had it in a handy pdf, and being an old(er) guy, I like having my reading materials in paper form.
And you know how I feel about hinges

Attachments
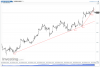
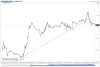
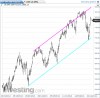
I know this is not about the NQ, but..applying the SLA to Crude on the longer timeframe...,
I am hoping for a retracement in the overnight session, to take a short position.
I am hoping for a retracement in the overnight session, to take a short position.
Attachments
A genuine question for you guys that assign significance to volume: The volume reported for any bar (regardless of timeframe), do you ever consider where in that bar the majority of volume was distributed? Was it spread evenly at all price levels in the bar, or lumpy, or mostly at the high end or the low end?
You see my point? And before you suggest dropping down a timeframe, or two, or more, to get the finer detail, I'm going to suggest that the logical end point of that is the tick, where volume becomes largely indeterminate.
I'm not saying volume is useless, far from it, but just using plain old volume per bar is just that. If you don't have a price:volume structure per bar than you are better off without it altogether.
You see my point? And before you suggest dropping down a timeframe, or two, or more, to get the finer detail, I'm going to suggest that the logical end point of that is the tick, where volume becomes largely indeterminate.
I'm not saying volume is useless, far from it, but just using plain old volume per bar is just that. If you don't have a price:volume structure per bar than you are better off without it altogether.

A genuine question for you guys that assign significance to volume: The volume reported for any bar (regardless of timeframe), do you ever consider where in that bar the majority of volume was distributed? Was it spread evenly at all price levels in the bar, or lumpy, or mostly at the high end or the low end?
You see my point? And before you suggest dropping down a timeframe, or two, or more, to get the finer detail, I'm going to suggest that the logical end point of that is the tick, where volume becomes largely indeterminate.
I'm not saying volume is useless, far from it, but just using plain old volume per bar is just that. If you don't have a price:volume structure per bar than you are better off without it altogether.
In this case, it doesn't matter. The point, assuming you read the pdf, is that the volume pattern is wrong for what might otherwise be considered a hinge, whether one posts a 1t chart or something with a larger interval (using the same timeframe, of course; the timeframe is six hours, regardless of the bar interval used).
I know this is not about the NQ, but..applying the SLA to Crude on the longer timeframe...,
I am hoping for a retracement in the overnight session, to take a short position.
I haven't studied crude, so I have no opinion to offer. It might be applicable. Be interesting to find out. But I assume crude is mean-reverting, so AMT might be of more use. Let us know.
I know this is not about the NQ, but..applying the SLA to Crude on the longer timeframe...,
I am hoping for a retracement in the overnight session, to take a short position.
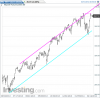
Your line was broken weeks ago, now you are in a Trend Channel that you have to consider.
- Status
- Not open for further replies.