Ghost of If You Can Draw A Straight Line

Status
Not open for further replies.
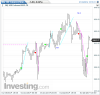
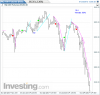
So far sellers are showing that they are holding the ball, even though they found some buyers at 06, buyers gave up at 12 that was not only 50% of the downmove but yesterday´s high.

At this moment buyers are pushing upwards but unless they manage to take out 12 my interpretation of this PA is that we are in the middle of a RET in the context of a downmove, therefore looking for a short.

Given that the effort and the failure took place in the middle of the night, it'll be interesting to see what daytime traders do at the NY open.
 
At 50% again.

8:42 Now above it. Seems like the tables are turning, lets see if buyers can make it all the way to 20.
 
At 50% again.

8:42 Now above it. Seems like the tables are turning, lets see if buyers can make it all the way to 20.

There appears to be a lot of mean reversion going on here. If so, price will reverse at 19-20.
 
I'm posting this here even though it has more to do with chat because there's no place else to put it. OTOH, it is an hourly chart and the "lesson" applies to all trading having to do with an hourly chart, at least the sort of trading addressed here.

So.

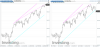
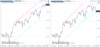
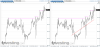
There is a tendency among inexperienced traders to focus on "support" and "resistance", particularly the lateral kind, trading ranges and all that. And it is clear from the chart on the left that there are certain levels that buyers have issues with, particularly the first one.

However, if price is rising, there is an uptrend. It may be sloppy as hell, but there is an uptrend. Sometimes one gets lucky and the trend forms a channel. This channel will have an easily-determined mean (the red line in the righthand chart), and often those unexplained reversals are the result of bouncing off that mean, though the mean may do no more than hold price in place.

Paying attention to both lateral support and resistance as well as the upper and lower limits of a trend channel can seem like rubbing one's stomach and patting one's head at the same time, but it pays to at least keep both these axes in mind when making rapidfire RT decisions. If nothing else, an awareness of this channel will help to explain why price doesn't just take off and keep going.

attachment.php
 

Attachments

  • JanHrly12.png
    JanHrly12.png
    39.2 KB · Views: 387
Traders -- and trolls -- will note that price tried to rise out of its channel a couple of hours after I made the above post but then several hours later plunged EXACTLY, before bouncing, to the line that I drew to represent the mean of the channel.

This is not magic. This is about how markets work. It has nothing to do with indicators or "patterns". It has nothing to do with engulfing this or spinning that. It has nothing to do with Gitche Gumee bars. Those who titter and snort about supply and demand will continue to underperform -- or fail outright -- because they won't see these moves coming, nor will they know what to do with them if they happen to notice them in real time.

(ET isn't allowing attachments this morning, but what I've described above is easy enough to see by anyone who views a current chart of the above, the "plunge" occurring at 2200.)

Good trading to everyone today.
 
The charts below are a follow-on to a premarket "call" I made in the Bride thread. I said in chat that I would show how I came up with it. However, it is an extension of what I've been doing here with regard to daily and hourly charts, so I'm posting the charts here.

The first is a chart I posted two or three weeks ago. It was an update of the original daily I posted at the beginning of the thread:

attachment.php


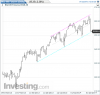
My intention at the time was to show that the balance between supply and demand was appearing to shift toward the supply side as price was having difficulty reaching the top of the trend channel (this is why one draws these things in the first place).

It quickly became clear, however, that this change in the arc was creating a new channel. So I treated it as one and drew trend lines a la Wyckoff for my own amusement:

attachment.php


And bringing all of this forward to today, we have this. Today's bar, of course, was not there this morning, but I had a good idea based on AMT that price would end up somewhere down here.

attachment.php


And that's just about it. Supply & Demand and Trend. All provided in advance.
 

Attachments

  • JanDly.png
    JanDly.png
    51.3 KB · Views: 260
  • JanDlyb.png
    JanDlyb.png
    53.3 KB · Views: 257
  • JanDlyc.png
    JanDlyc.png
    31.8 KB · Views: 250
The following are updates to the continuing series of hourly charts I've been posting from the beginning. These will likely be the last since those who don't get it by now probably won't and ought to explore other paths.

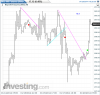
The eventual winrate turned out to be 80%, which is typical. The profit-to-loss ratio was, shall we say, high.

attachment.php


attachment.php


attachment.php
 

Attachments

  • JanHrly11.png
    JanHrly11.png
    37.9 KB · Views: 241
  • JanHrly13.png
    JanHrly13.png
    32.6 KB · Views: 247
  • JanHrly14.png
    JanHrly14.png
    34 KB · Views: 252
Thanks for the posts DB. I am sure this weekend we will hear a lot about a "Black Monday" scenario a la 1987. Looking forward to Sunday night.
 
Status
Not open for further replies.
Back
Top