
You are using an out of date browser. It may not display this or other websites correctly.
You should upgrade or use an alternative browser.
You should upgrade or use an alternative browser.
GBA Presents: House of Gummy-!
- Thread starter stonedinvestor
- Start date
I was curious how Putin would kill him. Was it psychopathic or sociopathic to think you’re immune from Vlad?It was an Embraier 160 apparently.
If you listen, you can hear the engines running while it's falling like a rock out of the sky and gushing fuel. To me, that's a plane whose tail was shot off.
I should get one of those crypto-wallets and ask Baron if I can put out a tip jar.Here's a contrary after-hours play.... short TSLA up here at $244
It's way up on NVDA too.
I bet TSLA drops like a rock tomorrow.
That money is gonna chase NVDA now.

Here's a contrary after-hours play.... short TSLA up here at $244
It's way up on NVDA too.
I bet TSLA drops like a rock tomorrow.
That money is gonna chase NVDA now.
What should I do about TTWO?
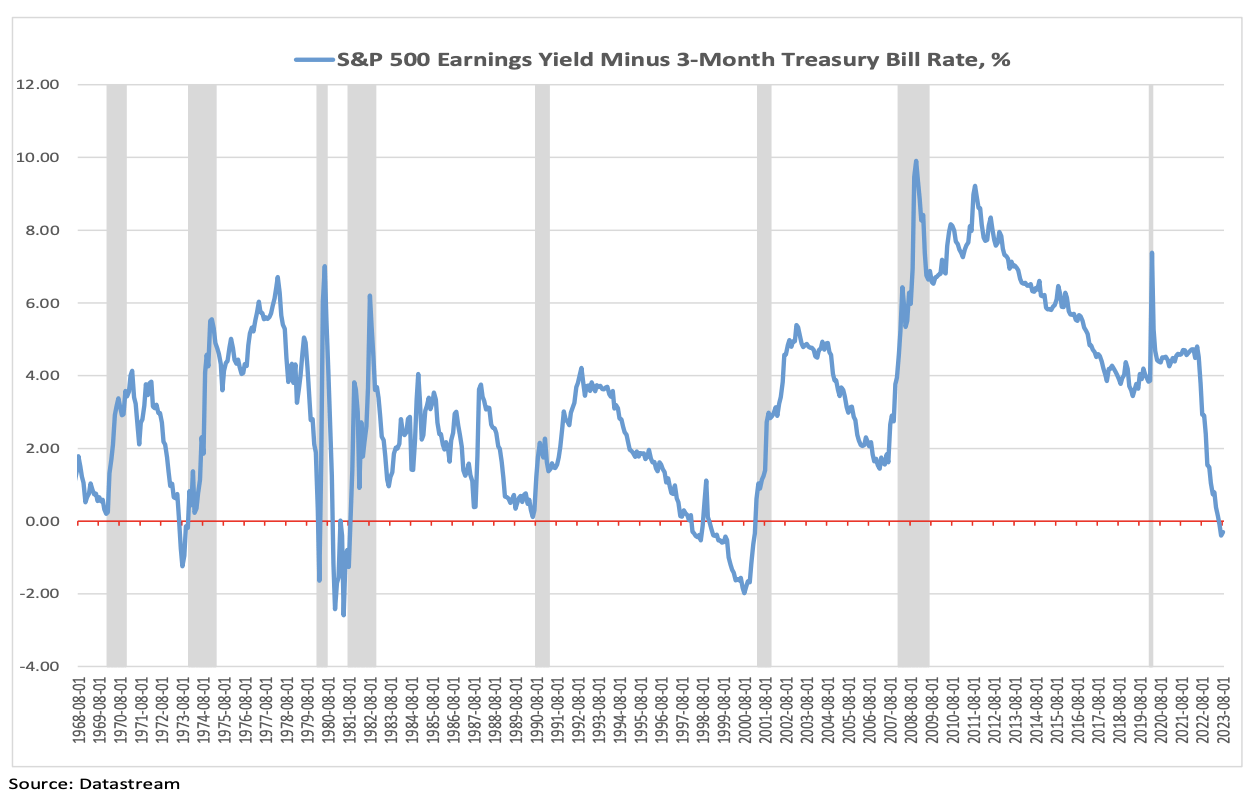
The broader stock market is facing a collision between high equity valuations and high rates on risk-free cash assets, according to Roth MKM.
"With Treasury bill yields (US12M) (US6M) (SHY) now pushing about 5.5%, we now have a negative equity risk premium on the S&P 500 (SP500) (NYSEARCA:SPY) (IVV) (VOO) if we use the rates on risk-free cash assets as a discount rate, something that has not been seen since the early 2000s," Michael Darda, chief economist and market strategist, said.
Darda says this "may be sustainable in a theoretical sense" if
"Treasury bill yields were above the earnings yield on the S&P 500 prior to the market selloffs of the early 1970s, early 1980s, 1998, and the nearly three-year bear market of 2000-2002," Darda notes. "In other words, it is unusual for the yields on risk-free cash assets to be above the earnings yield on stocks."
"When this has been the case, major equity market corrections have ensued and short rates have come down," he said. "The largest equity market declines were seen when we had the combination of a negative cashed-based ERP coupled with recession (1973-1975, 1981-82, and 2001). Inverted yield curves and negative growth in real monetary aggregates also preceded these recessions and bear markets."
"Those arguing that the yield curve will dis-invert and resume a normal upward slope by way of long rates rising relative to short rates are making an argument that has zero precedent in U.S. history," he said.
"The closest parallel we have (which still featured a flat curve, not a steeply upward-sloping one) was during 2007 when the 10-year yield (US10Y) (TBT) (TLT) briefly rose back above the Fed’s policy rate, but this was just before a deep recession and bear market forced the Fed to collapse the short end of the yield curve."
"Yield curves tend to be flat-or-inverted when unemployment is at or near a cyclical trough," Darda said. "Conversely, yield curves tend to be steep when unemployment is high or near a cyclical peak. The way the curve reverts to a steep slope from a deeply negative one runs through a higher unemployment rate and lower Fed policy rate."
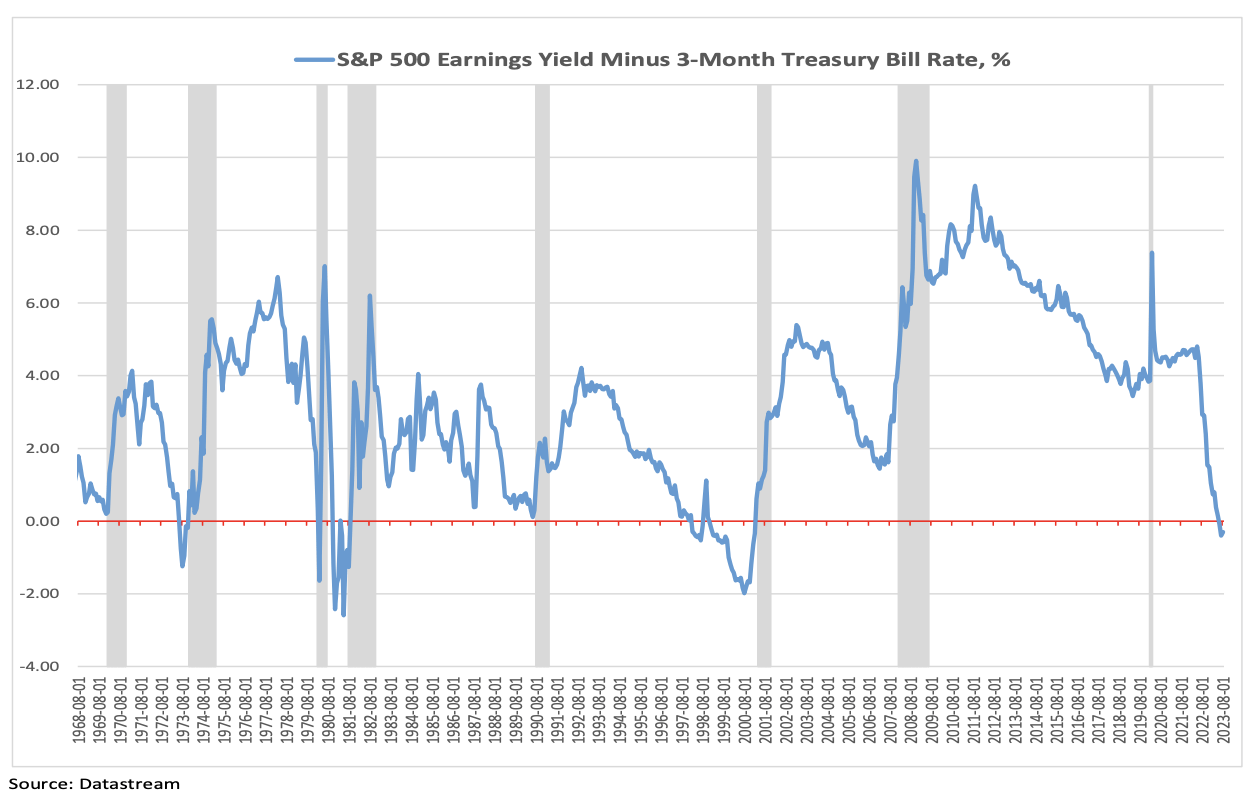
"With Treasury bill yields (US12M) (US6M) (SHY) now pushing about 5.5%, we now have a negative equity risk premium on the S&P 500 (SP500) (NYSEARCA:SPY) (IVV) (VOO) if we use the rates on risk-free cash assets as a discount rate, something that has not been seen since the early 2000s," Michael Darda, chief economist and market strategist, said.
Darda says this "may be sustainable in a theoretical sense" if
- There were no "future shocks to the business cycle."
- The Fed is able to "perfectly track the so-called r* with its policy rate in real time."
"Treasury bill yields were above the earnings yield on the S&P 500 prior to the market selloffs of the early 1970s, early 1980s, 1998, and the nearly three-year bear market of 2000-2002," Darda notes. "In other words, it is unusual for the yields on risk-free cash assets to be above the earnings yield on stocks."
"When this has been the case, major equity market corrections have ensued and short rates have come down," he said. "The largest equity market declines were seen when we had the combination of a negative cashed-based ERP coupled with recession (1973-1975, 1981-82, and 2001). Inverted yield curves and negative growth in real monetary aggregates also preceded these recessions and bear markets."
"Those arguing that the yield curve will dis-invert and resume a normal upward slope by way of long rates rising relative to short rates are making an argument that has zero precedent in U.S. history," he said.
"The closest parallel we have (which still featured a flat curve, not a steeply upward-sloping one) was during 2007 when the 10-year yield (US10Y) (TBT) (TLT) briefly rose back above the Fed’s policy rate, but this was just before a deep recession and bear market forced the Fed to collapse the short end of the yield curve."
"Yield curves tend to be flat-or-inverted when unemployment is at or near a cyclical trough," Darda said. "Conversely, yield curves tend to be steep when unemployment is high or near a cyclical peak. The way the curve reverts to a steep slope from a deeply negative one runs through a higher unemployment rate and lower Fed policy rate."
It seems every REIT is going down....
As Wall Street grapples with the latest Federal Reserve meeting minutes that suggest more interest rate hikes could be forthcoming, droves of analysts have been slashing price targets on interest-sensitive stocks such as real estate investment trusts (REITs). Over the past week,18 price targets across multiple sectors have been lowered, with no letup in sight. An almost equal number of price targets also were cut in the previous week.
In fairness, an equal number of price target raises have occurred this past week, but 13 of the 18 originated with just three analysts: Anthony Paolone of JPMorgan, Steve Sakwa of Evercore ISI Group and Craig Schmidt of Bank of America Securities. The price hikes affected just three subsectors — Paolone raised price targets on four residential REITs, Sakwa raised targets on seven office REITs, and Schmidt raised targets on two retail REITs.
By contrast, 12 analysts lowered price targets on seven REIT subsectors. Of the 18 price cuts, 15 were on REITs where the analyst maintained the previous rating, and three were on new downgrades.
Given the recent news on interest rates, along with weakness in the REIT sector, it's possible that further price target cuts could negatively affect REIT prices for the remainder of 2023.
... Our REIT of interest is edging up in the face of this....
As Wall Street grapples with the latest Federal Reserve meeting minutes that suggest more interest rate hikes could be forthcoming, droves of analysts have been slashing price targets on interest-sensitive stocks such as real estate investment trusts (REITs). Over the past week,18 price targets across multiple sectors have been lowered, with no letup in sight. An almost equal number of price targets also were cut in the previous week.
In fairness, an equal number of price target raises have occurred this past week, but 13 of the 18 originated with just three analysts: Anthony Paolone of JPMorgan, Steve Sakwa of Evercore ISI Group and Craig Schmidt of Bank of America Securities. The price hikes affected just three subsectors — Paolone raised price targets on four residential REITs, Sakwa raised targets on seven office REITs, and Schmidt raised targets on two retail REITs.
By contrast, 12 analysts lowered price targets on seven REIT subsectors. Of the 18 price cuts, 15 were on REITs where the analyst maintained the previous rating, and three were on new downgrades.
Given the recent news on interest rates, along with weakness in the REIT sector, it's possible that further price target cuts could negatively affect REIT prices for the remainder of 2023.
... Our REIT of interest is edging up in the face of this....
Last I checked last night SNOW had reversed a third time and was heading up... we shall see.
MongoDB is too expensive to flip into.
MongoDB is too expensive to flip into.
Grab Holdings price target raised to $6 from $4 at Benchmark » 07:13 GRAB 
Grab Holdings price target raised to $5.20 from $4.80 at Citi » 06:19 GRAB
Grab Holdings price target raised to $5.20 from $4.80 at Citi » 06:19 GRAB
2 Possible Gummies__
1 ZUO
Zuora raises FY24 EPS view to 21c-23c from 15c-17c, consensus 16c » 16:11 ZUO
2- HOWL
Werewolf Therapeutics initiated with Outperform, $9 target at Wedbush » 05:03 HOWL
1 ZUO
Zuora raises FY24 EPS view to 21c-23c from 15c-17c, consensus 16c » 16:11 ZUO
2- HOWL
Werewolf Therapeutics initiated with Outperform, $9 target at Wedbush » 05:03 HOWL
I transition today. Heading up to Ct at lunch.
The next Federal Reserve confab on interest rates takes place on Sept. 19-20. And the meeting of central bank chiefs in Jackson Hole, Wyo., begins on Thursday. Expect a brief speech by Fed chief Jerome Powell on Friday morning to move equities.
GUMMYBEAR SPECIAL OFFER-! FREE PICKS... OH WAIT YOU ALREADY HAVE THAT.
Stock Market Forecast For S&P 500 At Year's End
Wall Street still eyes the possibility the U.S. central bank could raise short-term interest rates by at least 25 basis points later in the year.
Nonetheless, market veterans see a touch of gains in stock prices ahead.
Last week, the 500 added another 1% and reached 4607. It hit levels not seen since April 2022.
Earlier in June, the S&P 500 had already barreled past many Wall Street firms' forecasts that it would hit 4200 to 4300 by year's end. STONEDINVESTOR at GummyBear Advisors raised his S&P target to 4,500 and others agree.
Veteran market observer and economic forecaster BCA Research, in an early-June report titled "So Far, So Good On The Road To 4500," feels "vindicated" that the large-cap stock index at one point pulled to within 2% of its 2023 year-end forecast. But its optimism for the second half of the year? Clearly bridled.
First Half 2023 Vs. First Half 2003
"We remain tactically overweight equities but are preparing to transition to equal weight once the S&P 500 reaches 4500," the research firm wrote June 18. "Although the index may well peak above our target, we do not expect the rally will last beyond the summer."
The next Federal Reserve confab on interest rates takes place on Sept. 19-20. And the meeting of central bank chiefs in Jackson Hole, Wyo., begins on Thursday. Expect a brief speech by Fed chief Jerome Powell on Friday morning to move equities.
GUMMYBEAR SPECIAL OFFER-! FREE PICKS... OH WAIT YOU ALREADY HAVE THAT.
Stock Market Forecast For S&P 500 At Year's End
Wall Street still eyes the possibility the U.S. central bank could raise short-term interest rates by at least 25 basis points later in the year.
Nonetheless, market veterans see a touch of gains in stock prices ahead.
Last week, the 500 added another 1% and reached 4607. It hit levels not seen since April 2022.
Earlier in June, the S&P 500 had already barreled past many Wall Street firms' forecasts that it would hit 4200 to 4300 by year's end. STONEDINVESTOR at GummyBear Advisors raised his S&P target to 4,500 and others agree.
Veteran market observer and economic forecaster BCA Research, in an early-June report titled "So Far, So Good On The Road To 4500," feels "vindicated" that the large-cap stock index at one point pulled to within 2% of its 2023 year-end forecast. But its optimism for the second half of the year? Clearly bridled.
First Half 2023 Vs. First Half 2003
"We remain tactically overweight equities but are preparing to transition to equal weight once the S&P 500 reaches 4500," the research firm wrote June 18. "Although the index may well peak above our target, we do not expect the rally will last beyond the summer."