I decided to give fundseeder a go. In case you missed the earlier posts this is a platform where you can have your returns and trades sent, a bit like collective2. Because the returns come directly from your broker other people can have more confidence that they're "real", although of course you can still run multiple accounts and drop the worst.
Unlike the latter however this isn't a 'follower / social trading' site where you can get paid by people for copying your trades, instead the goal is that you might get picked up by potential investors or featured in Jack Schwagers next book. FS even intend to offer an incubation structure for qualifying traders.
Since I'm not looking for investors my main interest was in getting access to some interesting analytics, seeing how I am doing against other traders with the same style (systematic / futures / technical), and who knows maybe making it into the book.
As well as linking your account to IB so fundseeder can see your future trades and returns, you can have your returns history uploaded by IB, right from when your account opened. You can also upload unverified data, but it will be treated as such.
First the bad things:
Linking the account was very straightforward. But getting the historic returns transferred was a complete and utter nightmare. This required numerous emails to both IB and fundseeder to actually make the transfer happen. Apparently initially they forgot to send part of my position records. The problem is that nobody at fundseeder seems to do anything unless chased - they aren't proactive about getting back to you when there is an issue and getting it fixed. I found the IB guy very helpful in contrast.
Even once transferred I found that there were certain days where I had massive returns (both up and down) that were wrong. I quickly realised the problem is that the returns calculation only adjusts for a movement in NAV caused by changes in cash, but not for position transfers (if they haven't fixed this, then my top tip is that you can improve your FS track record by gradually transferring positions into your account from elsewhere...). There is a nice feature to request return corrections, which I duly used, but again it took a lot of chasing on my part to fix.
To give you some stats I registered and requested linking / uploading on the 24th February.... and finally got the correct returns uploaded today, the 10th March.
Historic trades aren't backfilled just returns. So trade statistics are only filled in from the point when you link the account. But given the horror I've had with historic returns, this isn't a bad thing.
AFAIK only other fundseeder members can see your returns, which could be other traders or presumably these mysterious potential investors. This kind of limits it for my purposes, since it would be nice to post a link so that people on ET could see my returns in near real time.
The documentation is a bit lacking; I mean the site is mostly easy to use and there is a pdf describing the statistics they calculate, but apart from that you're on your own.
The good things:
Unlike collective2 you only need to provide administrator access to your IB account. Because c2 assumes you might want to copy / follow other traders, rather than just lead, it wants your full trading privileges. Listen buddy, nobody gets full trading access to my account even if they promise not to use it without permission....
The analytics I can see are pretty good, with a nice range of benchmarks - and more to come. More below. As a naturally competitive person the leaderboard feature is very pleasant. Again, more below.
A quick tour: Leaderboards
The home page hosts the main leaderboards, plus what I assume are aggregated account curves for different kinds of strategy and asset class. There is also a 'leaderboards' page, where we can look at a leaderboard both overall, plus for any subtype of strategy / asset class. Incidentally there are around 170 active accounts on the site. The first 5,000 will get free registration so there seems to be plenty of space yet. The subtype strategy / asset class is self declared when you register so might not be accurate / consistent.
It's possible to click through to individual accounts and get pretty comprehensive stats. See "my account" below for a detailed view of what these are like.
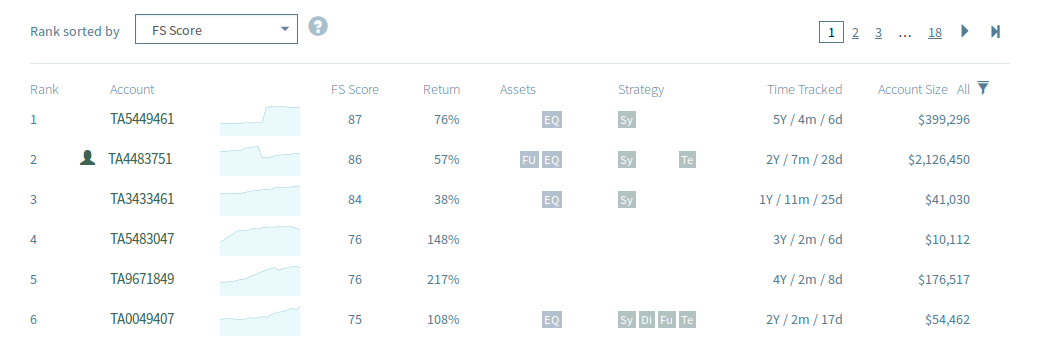
The person icon shows you where you are in the various leaderboards. The default ranking is by 'FS' score; which as I understand it is a sharpe ratio adjusted for statistical significance; thus people with more consistent returns over longer periods will be more highly ranked. I rather like this measure, and I've used something similar myself. And this isn't just because I'm currently ranked second overall... (and #1 in technical and futures trading)
You can also rank by other metrics. Out of interest the best sharpe was 3.73 with an FS score of 58 (the same guy had the best sortino and annualised return). Here's the account:
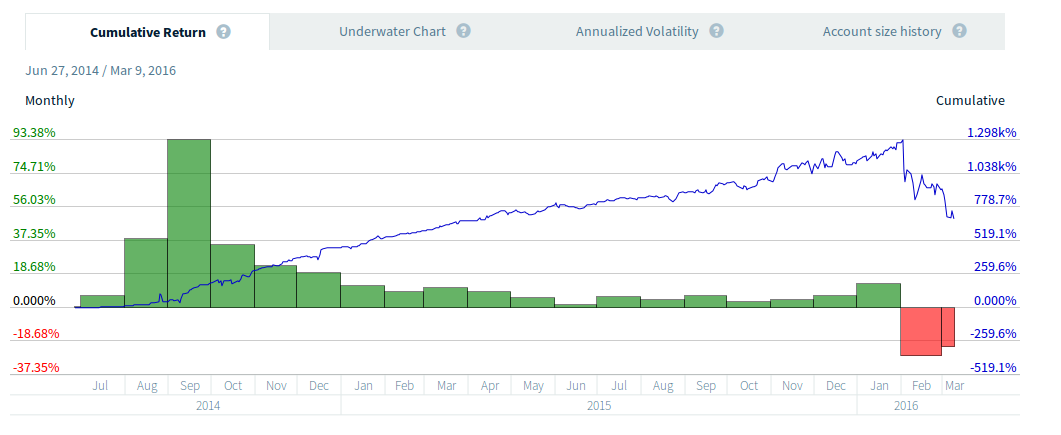
This account had quite a recent bad drawdown (50%) from what looks like a classic negative skew strategy. The risk control also leaves something to be desired.
In contrast the highest FS score of 87 had a sharpe of 'only' 1.42 but over 4 years and with a much more consistent performance and very consistent risk:
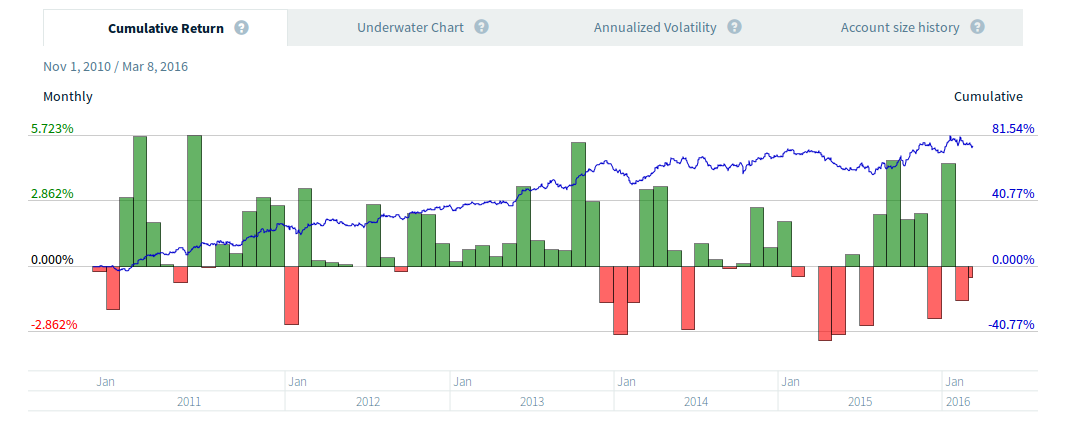
My own inconsistent risk targeting up to January 2015 (see below for details) may be penalising me a little, but so be it.
A quick tour: Fundseeder analytics
You can get even more interesting stats for your own account using the 'analytics' function.
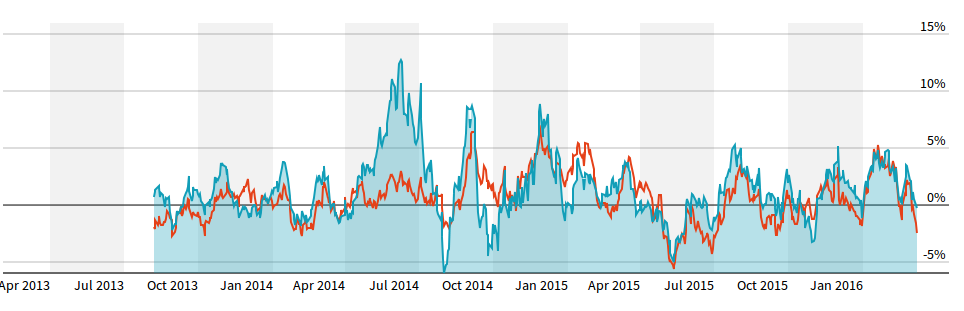
Here for example is the one month rolling return for my account (blue) plus the newedge CTA index (in red).
Same thing, for rolling six month sharpe ratio.
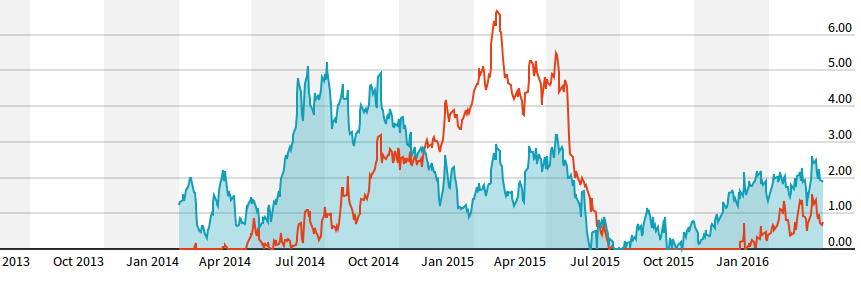
The period is configurable. You can also plot sortino, volatility and daily GPR. There are numerous benchmarks available.
There's also a drawdown plot. I'm less keen on the "equity curve analysis", as I don't think trading the equity curve is a worthwhile activity (see my blog). Interestingly the plots prove my point:
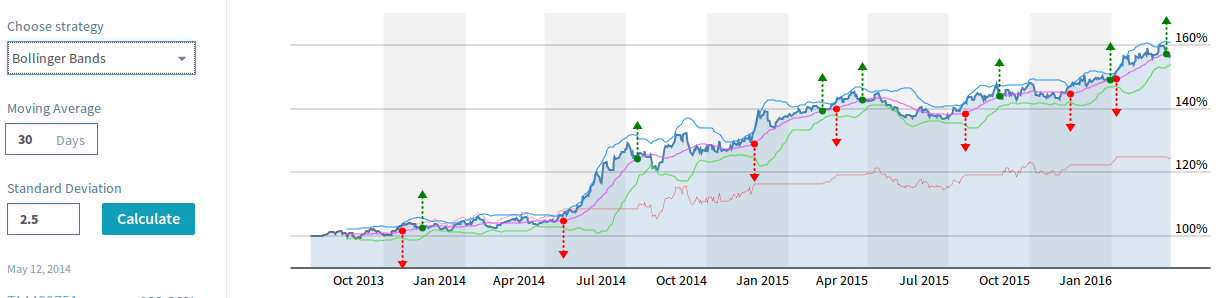
The faint red line is below the solid blue line; this is bad for equity curve trading. You can change the parameters are overfit to your hearts content. There are several methods for doing this; this one uses something called Bollinger bands which I thought was a kind of champagne
Many more analytics are in the pipeline. I love this kind of stuff, but could never justify the time to write it myself, certainly not with such a nice interface.
A quick tour: My account
This allows you to see your own statistics, plus edit your details, and of course as I said above report incorrect data!
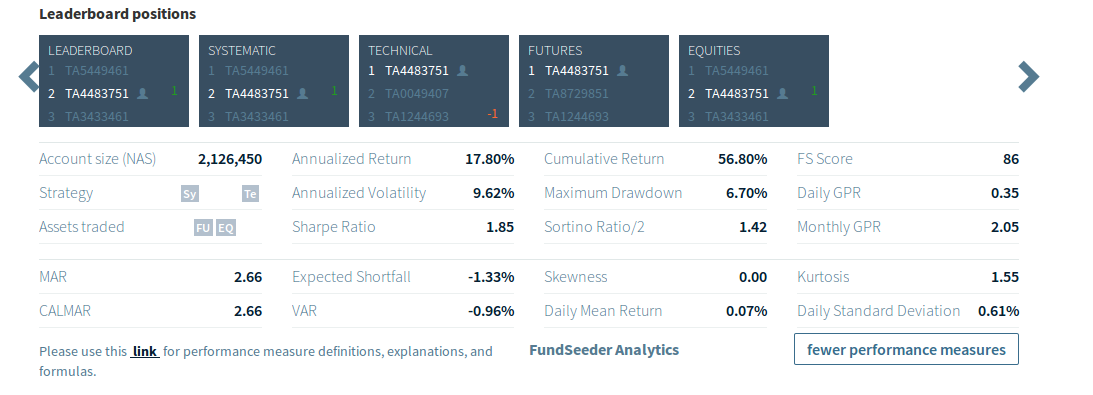
Here are the kinds of statistics you can see here. These are also available for any other trader, by clicking through from the leaderboard:
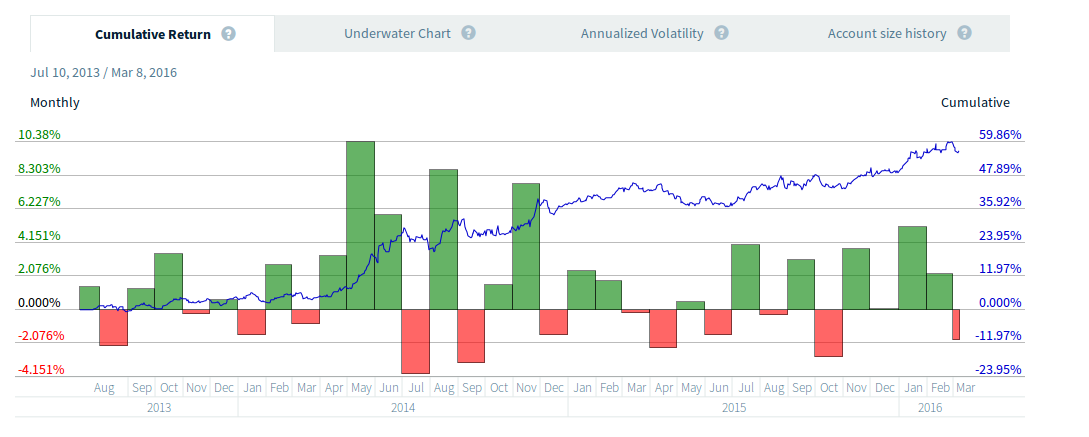
Cumulative return
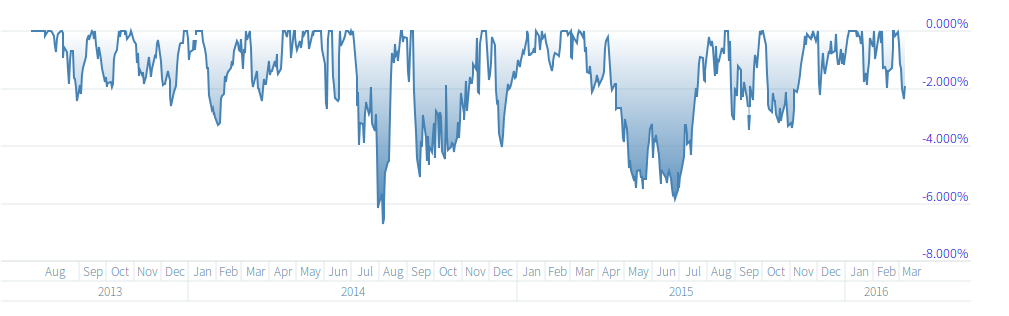
Underwater chart
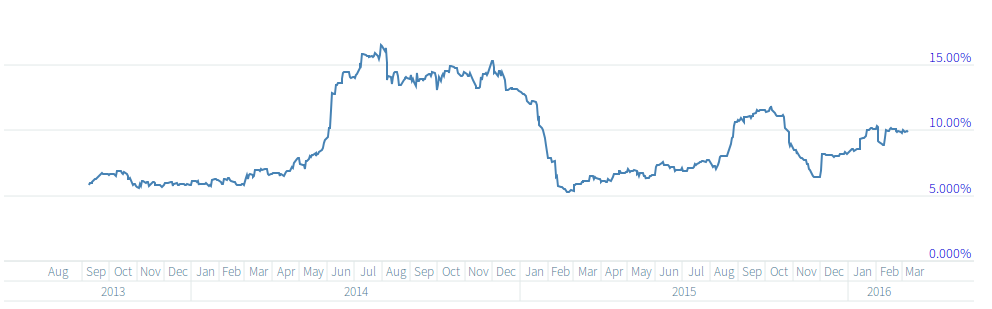
Annualised vol
You may notice that the drawdown, vol and return figures are lower than the ones I report on my own thread. That's because you have a choice of using the actual account value to work out % returns, or a fixed notional value. The latter has to be greater than the former. Since at times my account has been much larger than the amount of capital I have at risk (started at £300K, now £400K), I've used a fairly large fixed value of £1.5 million as my notional capital. This also brings my volatility down to more typical hedge fund levels (if anything a little lower than most CTA's).
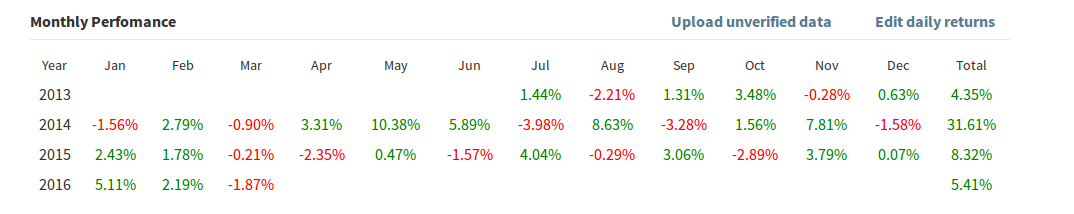
As you'll know if you followed my thread for the first few months I only had stock in my account and wasn't trading futures. Then I started trading futures with an annualised vol target of £150K (50% on £300K); this subsequently increased as I ramped up my capital at risk with profits. In January 2015 this dropped to a more reasonable £100K fixed maximum vol target. The changes since then reflect strength / weakness of forecasts.
Account size history
This shows the actual value of your account. Any withdrawals / deposits will be reflected here, but not in your returns.
Performance measures
Summary
This is a nice idea, some parts of which are well executed, other parts still have their teething troubles (in particular the historic data upload). Having made the initial investment of time to get this working I'm looking forward to using this in the future.
GAT
Unlike the latter however this isn't a 'follower / social trading' site where you can get paid by people for copying your trades, instead the goal is that you might get picked up by potential investors or featured in Jack Schwagers next book. FS even intend to offer an incubation structure for qualifying traders.
Since I'm not looking for investors my main interest was in getting access to some interesting analytics, seeing how I am doing against other traders with the same style (systematic / futures / technical), and who knows maybe making it into the book.
As well as linking your account to IB so fundseeder can see your future trades and returns, you can have your returns history uploaded by IB, right from when your account opened. You can also upload unverified data, but it will be treated as such.
First the bad things:
Linking the account was very straightforward. But getting the historic returns transferred was a complete and utter nightmare. This required numerous emails to both IB and fundseeder to actually make the transfer happen. Apparently initially they forgot to send part of my position records. The problem is that nobody at fundseeder seems to do anything unless chased - they aren't proactive about getting back to you when there is an issue and getting it fixed. I found the IB guy very helpful in contrast.
Even once transferred I found that there were certain days where I had massive returns (both up and down) that were wrong. I quickly realised the problem is that the returns calculation only adjusts for a movement in NAV caused by changes in cash, but not for position transfers (if they haven't fixed this, then my top tip is that you can improve your FS track record by gradually transferring positions into your account from elsewhere...). There is a nice feature to request return corrections, which I duly used, but again it took a lot of chasing on my part to fix.
To give you some stats I registered and requested linking / uploading on the 24th February.... and finally got the correct returns uploaded today, the 10th March.
Historic trades aren't backfilled just returns. So trade statistics are only filled in from the point when you link the account. But given the horror I've had with historic returns, this isn't a bad thing.
AFAIK only other fundseeder members can see your returns, which could be other traders or presumably these mysterious potential investors. This kind of limits it for my purposes, since it would be nice to post a link so that people on ET could see my returns in near real time.
The documentation is a bit lacking; I mean the site is mostly easy to use and there is a pdf describing the statistics they calculate, but apart from that you're on your own.
The good things:
Unlike collective2 you only need to provide administrator access to your IB account. Because c2 assumes you might want to copy / follow other traders, rather than just lead, it wants your full trading privileges. Listen buddy, nobody gets full trading access to my account even if they promise not to use it without permission....
The analytics I can see are pretty good, with a nice range of benchmarks - and more to come. More below. As a naturally competitive person the leaderboard feature is very pleasant. Again, more below.
A quick tour: Leaderboards
The home page hosts the main leaderboards, plus what I assume are aggregated account curves for different kinds of strategy and asset class. There is also a 'leaderboards' page, where we can look at a leaderboard both overall, plus for any subtype of strategy / asset class. Incidentally there are around 170 active accounts on the site. The first 5,000 will get free registration so there seems to be plenty of space yet. The subtype strategy / asset class is self declared when you register so might not be accurate / consistent.
It's possible to click through to individual accounts and get pretty comprehensive stats. See "my account" below for a detailed view of what these are like.
The person icon shows you where you are in the various leaderboards. The default ranking is by 'FS' score; which as I understand it is a sharpe ratio adjusted for statistical significance; thus people with more consistent returns over longer periods will be more highly ranked. I rather like this measure, and I've used something similar myself. And this isn't just because I'm currently ranked second overall... (and #1 in technical and futures trading)
You can also rank by other metrics. Out of interest the best sharpe was 3.73 with an FS score of 58 (the same guy had the best sortino and annualised return). Here's the account:
This account had quite a recent bad drawdown (50%) from what looks like a classic negative skew strategy. The risk control also leaves something to be desired.
In contrast the highest FS score of 87 had a sharpe of 'only' 1.42 but over 4 years and with a much more consistent performance and very consistent risk:
My own inconsistent risk targeting up to January 2015 (see below for details) may be penalising me a little, but so be it.
A quick tour: Fundseeder analytics
You can get even more interesting stats for your own account using the 'analytics' function.
Here for example is the one month rolling return for my account (blue) plus the newedge CTA index (in red).
Same thing, for rolling six month sharpe ratio.
The period is configurable. You can also plot sortino, volatility and daily GPR. There are numerous benchmarks available.
There's also a drawdown plot. I'm less keen on the "equity curve analysis", as I don't think trading the equity curve is a worthwhile activity (see my blog). Interestingly the plots prove my point:
The faint red line is below the solid blue line; this is bad for equity curve trading. You can change the parameters are overfit to your hearts content. There are several methods for doing this; this one uses something called Bollinger bands which I thought was a kind of champagne
Many more analytics are in the pipeline. I love this kind of stuff, but could never justify the time to write it myself, certainly not with such a nice interface.
A quick tour: My account
This allows you to see your own statistics, plus edit your details, and of course as I said above report incorrect data!
Here are the kinds of statistics you can see here. These are also available for any other trader, by clicking through from the leaderboard:
Cumulative return
Underwater chart
Annualised vol
You may notice that the drawdown, vol and return figures are lower than the ones I report on my own thread. That's because you have a choice of using the actual account value to work out % returns, or a fixed notional value. The latter has to be greater than the former. Since at times my account has been much larger than the amount of capital I have at risk (started at £300K, now £400K), I've used a fairly large fixed value of £1.5 million as my notional capital. This also brings my volatility down to more typical hedge fund levels (if anything a little lower than most CTA's).
As you'll know if you followed my thread for the first few months I only had stock in my account and wasn't trading futures. Then I started trading futures with an annualised vol target of £150K (50% on £300K); this subsequently increased as I ramped up my capital at risk with profits. In January 2015 this dropped to a more reasonable £100K fixed maximum vol target. The changes since then reflect strength / weakness of forecasts.
Account size history
This shows the actual value of your account. Any withdrawals / deposits will be reflected here, but not in your returns.
Performance measures
Summary
This is a nice idea, some parts of which are well executed, other parts still have their teething troubles (in particular the historic data upload). Having made the initial investment of time to get this working I'm looking forward to using this in the future.
GAT