You are using an out of date browser. It may not display this or other websites correctly.
You should upgrade or use an alternative browser.
You should upgrade or use an alternative browser.
Fully automated futures trading
- Thread starter globalarbtrader
- Start date
Hello Rob,Hope you enjoy the book.
Picking stocks in this way isn't curve fitting; it's a perfectly reasonable thing to do (equity neutral hedge funds do exactly this; though obviously on the short side as well - and they also use a bunch of other filters apart from relative strength). Clearly a combination of a loose filter and a small number of stocks (3) will result in a portfolio with a lot of company specific risk.
If I was implementing this kind of strategy I'd probably look to hold at least 20 positions, probably more, depending on any fixed costs you had to pay to trade (fixed costs per ticket make trading small positions uneconomic). If you're not leveraging then you could invest all your 200K - so that's 10K a position and you could probably go lower. And I'd limit the universe as you suggested to more liquid stocks.
The other concern I have is trading costs. If you're doing this every day, and you're only holding a very small number of stocks, your turnover would be insane. Again if I was doing this I'd use (a) a slow measure of relative strength (maybe 3 months), (b) a relatively large number of stocks. Together this would reduce the number of stocks that are drifting in and out each day should be reduced to a point where the costs aren't killing you.
GAT
I saw a presentation you gave at Quantcon (I believe) where you discussed system building and created an example of a trend-following system that used regression slope as the determinant of trend. I have several questions re your presentation that I'd like to ask you. What's the best place to post those .... here, https://qoppac.blogspot.com/ or maybe somewhere else? Thanks
Hello Rob,
I saw a presentation you gave at Quantcon (I believe) where you discussed system building and created an example of a trend-following system that used regression slope as the determinant of trend. I have several questions re your presentation that I'd like to ask you. What's the best place to post those .... here, https://qoppac.blogspot.com/ or maybe somewhere else? Thanks
Here is fine
To roll, I use the past year's history of rolls as general guidelines. So, if an instrument rolled on March 15th 2017, on March 1st 2018, I will start looking at the volume and the ba spread of the logical next contract. Once the ba spread and volume of the next contract are fairly close to the one I'm holding, which would probably be close to March 15th 2018, I elect to roll. I have a separate python program that gathers prices each day from the quadl api. So, I can tell it to roll, and I specify the new contract I will be holding, as well as the next carry contract, with which I'll measure carry. The program then starts collecting the prices on the new contracts, each day. For the continuous price csv file, the program takes the prior day's price of the new contract minus the prior day's price of the old contract and adds the result to every historical price (before the date of the roll) in the continuous price series. I believe this is the correct implementation of the Panama method, which GAT recommends.
Thanks, did you manage to get the same price in legacycsv by GAT?
I use quandl excel add in to download historical vix contract data. I think i use the data source by chris, which gives a continous price.
As GAT might have mentioned in his posts, the stitched price will vary subtly based on the roll algo (i.e. which day your algo stitches prices together as that determines the size of the adjustments) and which price contract you use. For that reason Quandl's own rolling algo is unlikely to match exactly what is stored in GAT's csv files. But it also shouldn't be wildly off. Have you eyeballed the comparative charts and seen a huge difference? As a x-check, I have run a comparision between my VIX with GAT's csv data and ignoring the 100 times factor early in my data, this is what my stitching produces. It is different but I am not too worried (unless of course GAT jumps in and says I should be ") ), because the broad pattern is v similar.
), because the broad pattern is v similar.
), because the broad pattern is v similar.Attachments
Thanks, did you manage to get the same price in legacycsv by GAT?
I use quandl excel add in to download historical vix contract data. I think i use the data source by chris, which gives a continous price.
I don't use the continuous price series from quandl, I use the ones that have true prices and contract dates. The reason for this is that I am creating my own continuous price series with the method I described before. I guess it doesn't make much difference which you use. My prices should match GAT's csvs extremely closely, since I am replicating his method as far as I know.
I don't use the continuous price series from quandl, I use the ones that have true prices and contract dates. The reason for this is that I am creating my own continuous price series with the method I described before. I guess it doesn't make much difference which you use. My prices should match GAT's csvs extremely closely, since I am replicating his method as far as I know.
Can I clarify that for signal generation, we use the stitched prices?
What about pnl calculation? Do we use original prices or the stitched prices?
It's pretty much my last 'working' day of the year so I thought I'd do quick annual update of my performance.
I appreciate there haven't been many of these recently, but I've been pretty busy with this. Next year I should have more time to tend to some things I've been neglecting: my blog, pysystemtrade and perhaps even some new research. I'll also be giving some thought to my next book.
This won't be massively detailed, as per usual I'll be doing a more detailed update on my blog at the end of the UK tax year in early April.
YTD: 10.8%
PNL for this tax year: 6.0%
PNL to date: 105.6%
Drawdown: 6.3%
I haven't done any formal checks but that's probably behind AHL (who've had a stellar year and are running at around +10% on a lower risk target, depending on which fund you look at); although perhaps more respectable compared to the rest of the CTA industry. I won't know for sure until I break out my equity hedge, which I won't do until April.
It's also about half of last years calendar year performance of around 20%. Basically I seem to be in a fairly flat period that's lasted for about 18-21 months. But that's better than a 21 month drawdown and I have actually made new HWM in that period (most recently in November). 12 steps forward, 11 steps back... and repeat.
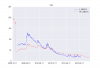
Pictures:


A real year of ups and downs
Current positions:
Current risk:
Trades:
17,902 trades (including rolls) Slippage £1,155 of which bid-ask spread was £5018 and exection algo was -£3863
GAT
I appreciate there haven't been many of these recently, but I've been pretty busy with this. Next year I should have more time to tend to some things I've been neglecting: my blog, pysystemtrade and perhaps even some new research. I'll also be giving some thought to my next book.
This won't be massively detailed, as per usual I'll be doing a more detailed update on my blog at the end of the UK tax year in early April.
YTD: 10.8%
PNL for this tax year: 6.0%
PNL to date: 105.6%
Drawdown: 6.3%
I haven't done any formal checks but that's probably behind AHL (who've had a stellar year and are running at around +10% on a lower risk target, depending on which fund you look at); although perhaps more respectable compared to the rest of the CTA industry. I won't know for sure until I break out my equity hedge, which I won't do until April.
It's also about half of last years calendar year performance of around 20%. Basically I seem to be in a fairly flat period that's lasted for about 18-21 months. But that's better than a 21 month drawdown and I have actually made new HWM in that period (most recently in November). 12 steps forward, 11 steps back... and repeat.
Pictures:
A real year of ups and downs
Current positions:
Code:
      code contractid  positions   Lock WrongContract InFwdNotRoll
7       AEX     201801          1  False         False        False
1       AUD     201803          1  False         False        False
11     BOBL     201803          1  False         False        False
9       CAC     201801          1  False         False        False
16     CORN     201812        -10  False         False        False
15  CRUDE_W     201812          1  False         False        False
18  EDOLLAR     202106         -3  False         False        False
0   EUROSTX     201803         -9  False         False        False (hedge)
14   GAS_US     201803         -2  False         False        False
2       JPY     201803         -1  False         False        False
8   LEANHOG     201806          1  False         False        False
10  LIVECOW     201810         -1  False         False        False
17      MXP     201803          5  False         False        False
6    NASDAQ     201803          1  False         False        False
13      OAT     201803          1  False         False        False
3    PALLAD     201803          2  False         False        False
5   SOYBEAN     201811         -3  False         False        False
12    SP500     201803          2  False         False        False
4     WHEAT     201812         -8  False         False        False
Current risk:
Code:
       code  multisignal  expected_annual_risk  expected_annual_risk_per_contract  position  expected_annual_risk_rounded_pos
36  EDOLLAR         -5.2                  3892                               1031        -2                              2063
2   LIVECOW         -6.3                  4752                               4026        -1                              4026
27      JPY         -9.9                  7465                               5644        -1                              5644
3   SOYBEAN        -13.6                 10202                               3382        -2                              6764
0      CORN        -20.7                 15504                               1472       -10                             14722
4     WHEAT        -26.2                 19669                               2525        -8                             20199

7      BOBL          2.5                  1852                               1957         1                              1957
1   LEANHOG          2.0                  1526                               3437         1                              3437
20      CAC          5.8                  4316                               4446         1                              4446
10      OAT          7.0                  5291                               6036         1                              6036
19      AEX         15.1                 11329                               8805         1                              8805
22   NASDAQ         10.8                  8121                               9200         1                              9200
28      MXP         10.9                  8147                               1910         5                              9550
23    SP500         14.9                 11220                               6390         2                             12780
32   PALLAD         27.2                 20383                              13647         1                             13647
35   GAS_US        -25.9                 19451                               7959        -2                             15919
Trades:
17,902 trades (including rolls) Slippage £1,155 of which bid-ask spread was £5018 and exection algo was -£3863
GAT