I wanted to explore this question of FX volatility and impact on base returns a little further, so I tried to set up a test. (Spoiler: your method wins- but I'm not sure why). What I'm really looking for here is a critique of my approach (which I think is wrong).
Test parameters:
Corn data (1991-Present), Bootstrapped (n=100), Carry & EWMAC, Base currency GBP, Transactions costs/slippage included
To be clear, I've calculated instrument value volatility as:
Code:
instrument_value_volatility = (prices * fx_rate).diff().ewm(span=36, min_periods=36).std()
where fx_rate is a series.
Important note:
Sharpe Ratios are calculated in the base currency.
Bootstrapping minimises the sharpe in the currency as well.
The bootstrap is performed on the whole period 1991-2016. I don't use rolling weights to calculate my historical Sharpe, so there is some implicit overfitting here.
Results:
Pysystemtrade method- Just use the fx_rate for position sizing, forecasts are on USD futures prices
Result: Sharpe 0.18
Proposed method- Convert original price series to base currency, then bootstrap. Forecasts will be on GDP.
Result: Sharpe 0.18
Conclusion? Doesn't seem to make much difference. Not entirely sure what I've learned here.
Next, I tried to break it up, and created a new indicator, ewmacfx, which operates on fx series rather than the corn series. The hypothesis is that we can capture the trend on both the corn and the fx.
I fed this into the bootstrap and got a weight distribution that looks like this:
View attachment 165135
(Just a reminder- this is optimising a Sharpe based on returns in the base currency GBP.)
Seems sensible enough to me.
The Catch: Running this produces a Sharpe of 0.10 (when using instrument value volatility to scale position sizes like you do) -
lower than before.
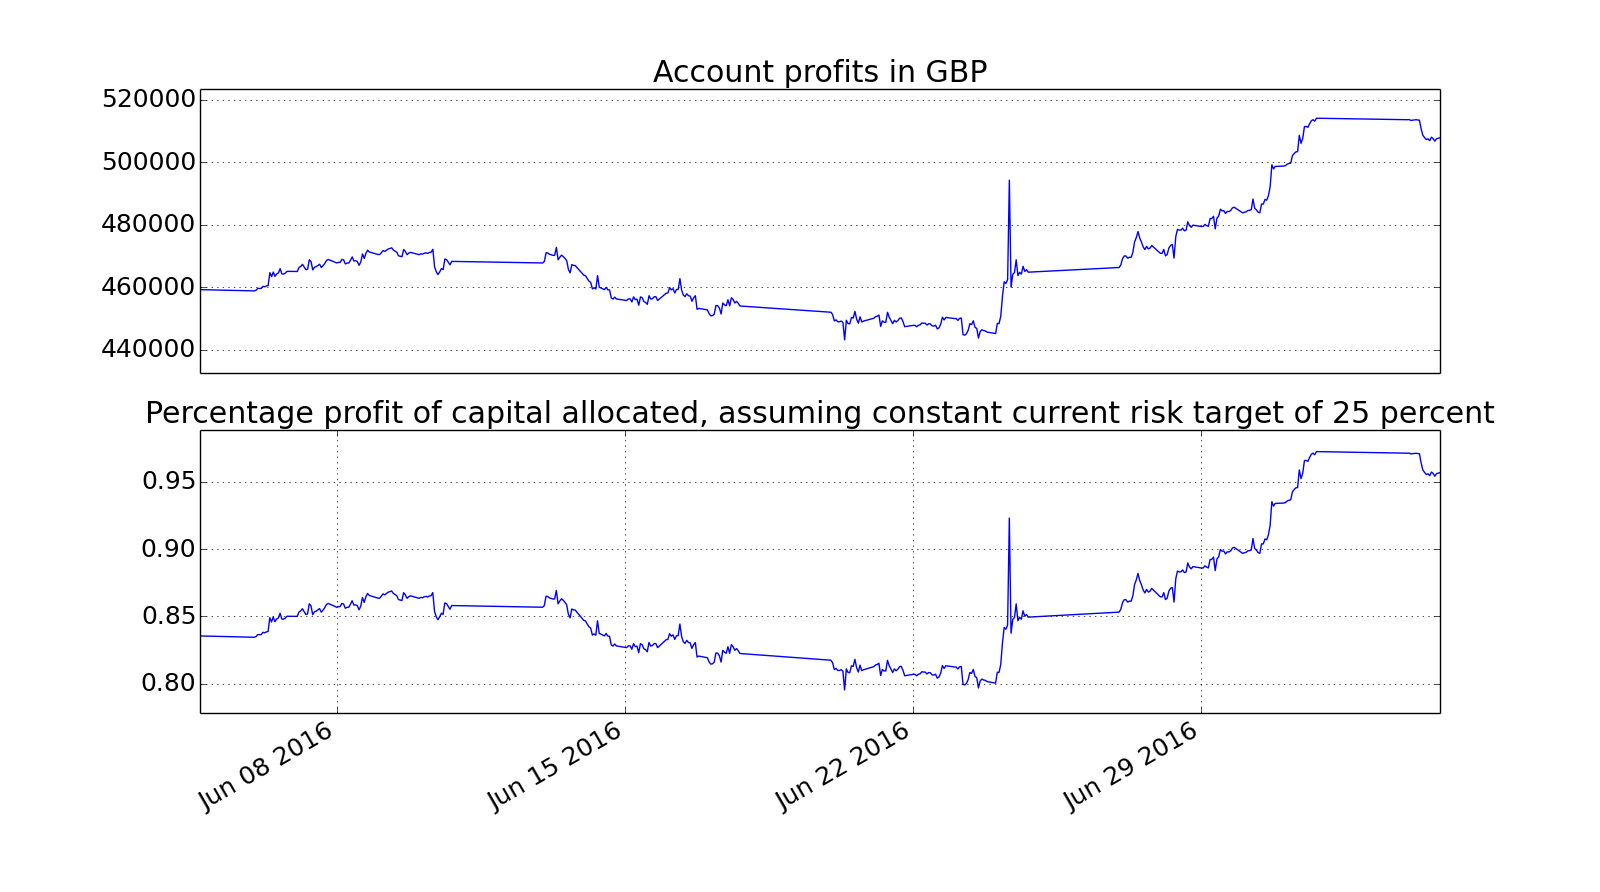
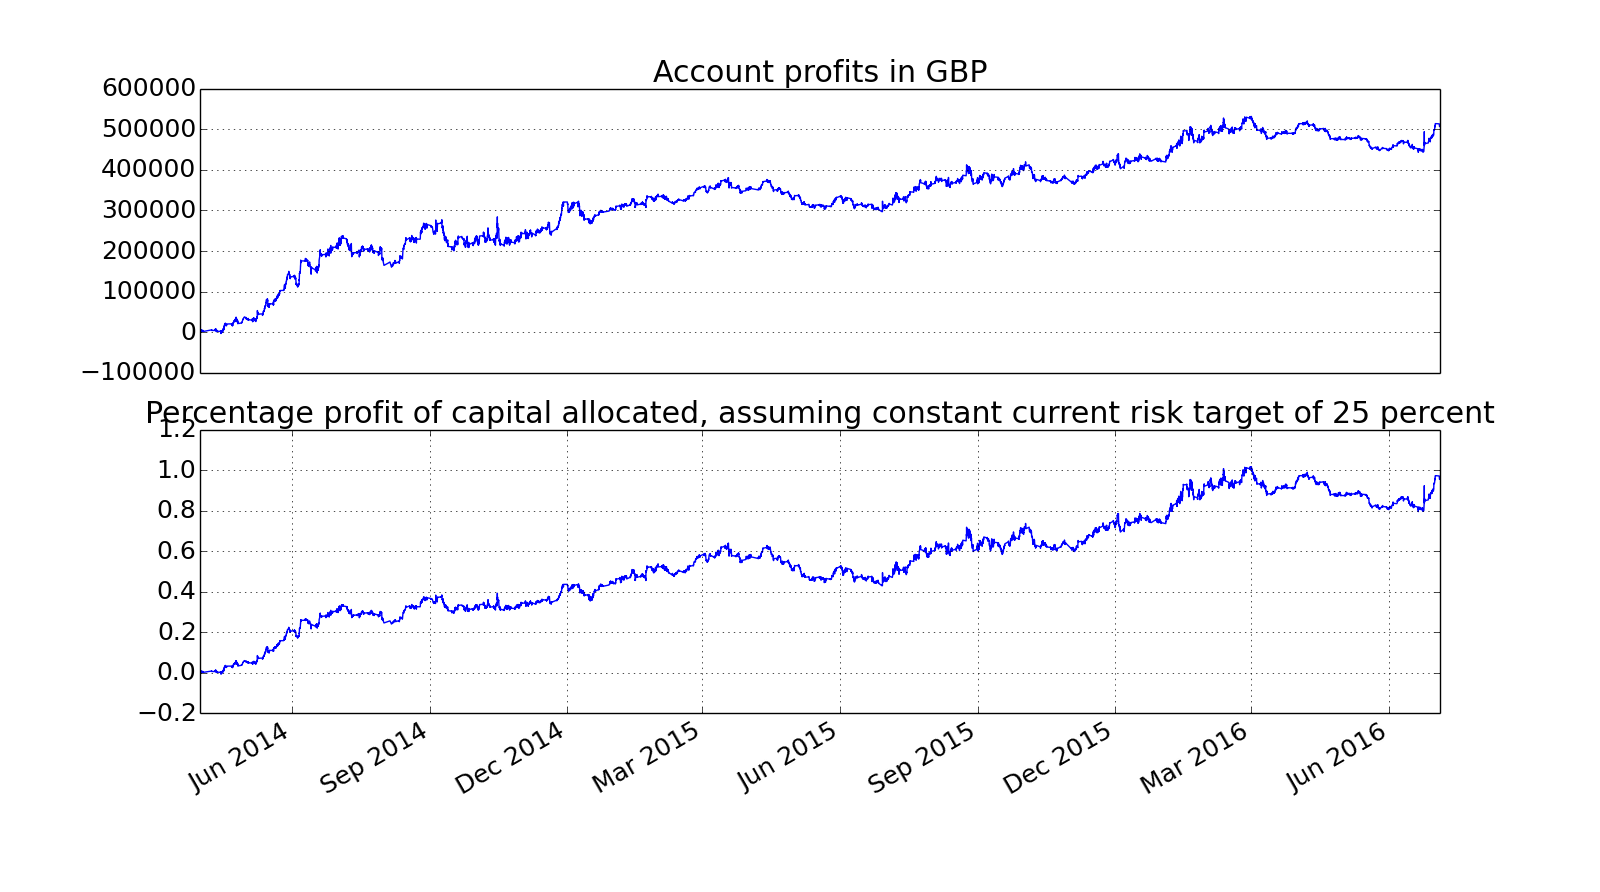
For reference, the Sharpe's for the individual account curves are here:
View attachment 165136
My Dilemmas:
- I had hoped that adding FX tracking rules to my bootstrap would have given me a better Sharpe, but it seems to make it worse. Is there any practical rationale for the approach of tracking them separately, as I have tried?
- I would have thought the bootstrap process would have increased Sharpe with the more rules you add (due to overfitting); I'm surprised that the opposite happened here. Is that what I should expect?
- Am I really wasting my time, and should crack on with the less interesting task of adding more instruments?
Thank you!
.png")