You are using an out of date browser. It may not display this or other websites correctly.
You should upgrade or use an alternative browser.
You should upgrade or use an alternative browser.
Fully automated futures trading
- Thread starter globalarbtrader
- Start date
Thanks for sharing your current status. It's comforting to know that I'm not the only one in drawdown right now. I'm 5% below high water mark.
Janet's recent statements really hurt 2 year treasuries and Eurodollar contracts.
Glad to be of service....
Monthly update: Last one was November 4th
Up 12% of capital, or around £48K
Last month:
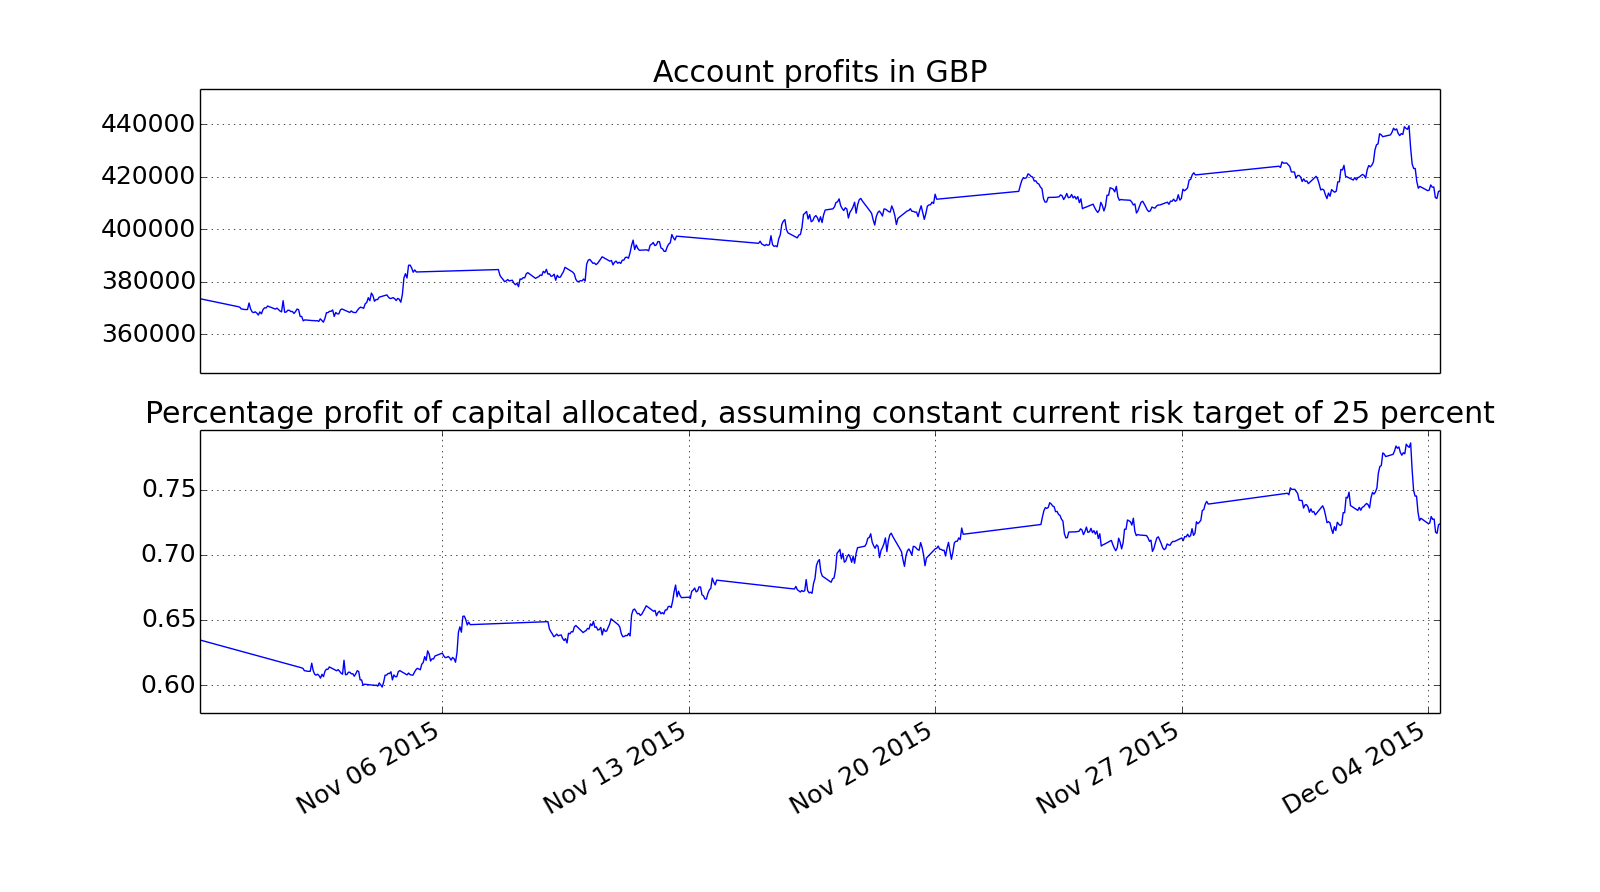
Longer term:
Well up to yesterday I was looking forward to telling you what a f**** genius I was, and actually posting at a HWM level for a change. Then Mr Draghi opened his big mouth and I dropped 4% very quickly indeed. Movements in european bonds were about 6-7 daily standard deviations (the much discussed Euro move was a mere 4). The system I use to manually alert me so I can check and filter large price movements triggered half a dozen times in a matter of minutes; normally it's a couple of months before each trigger.
It would have been even nastier but my hedged equity portfolio added a bit. Talking to friends last night in the CTA industry losses of 4% were fairly common (and I run at a higher vol target than most).
Still I'm still up for the week, and the month, so shouldn't really complain. You can barely see yesterdays move on the second set of charts above.
The real lesson here is that diversification and risk control are there exactly for this kind of situation. Which meant I could be relatively sanguine. Even I however find it hard not to be emotionally attached to day to day p&l. The difference is that it makes no difference whatsoever to the way my system trades, since I don't let my system know how bad or good I'm feeling")
Drawdown: 6.2% (off yesterday morning's new HWM)
Gainers:
Copper 8200
Platinum 8125
Gold 6700
Gas 6000
Crude 4500
Pallad 3700
Livecow 2600
Losers:
Eurodollars -2000
NASDAQ -2400
SP500 -2500
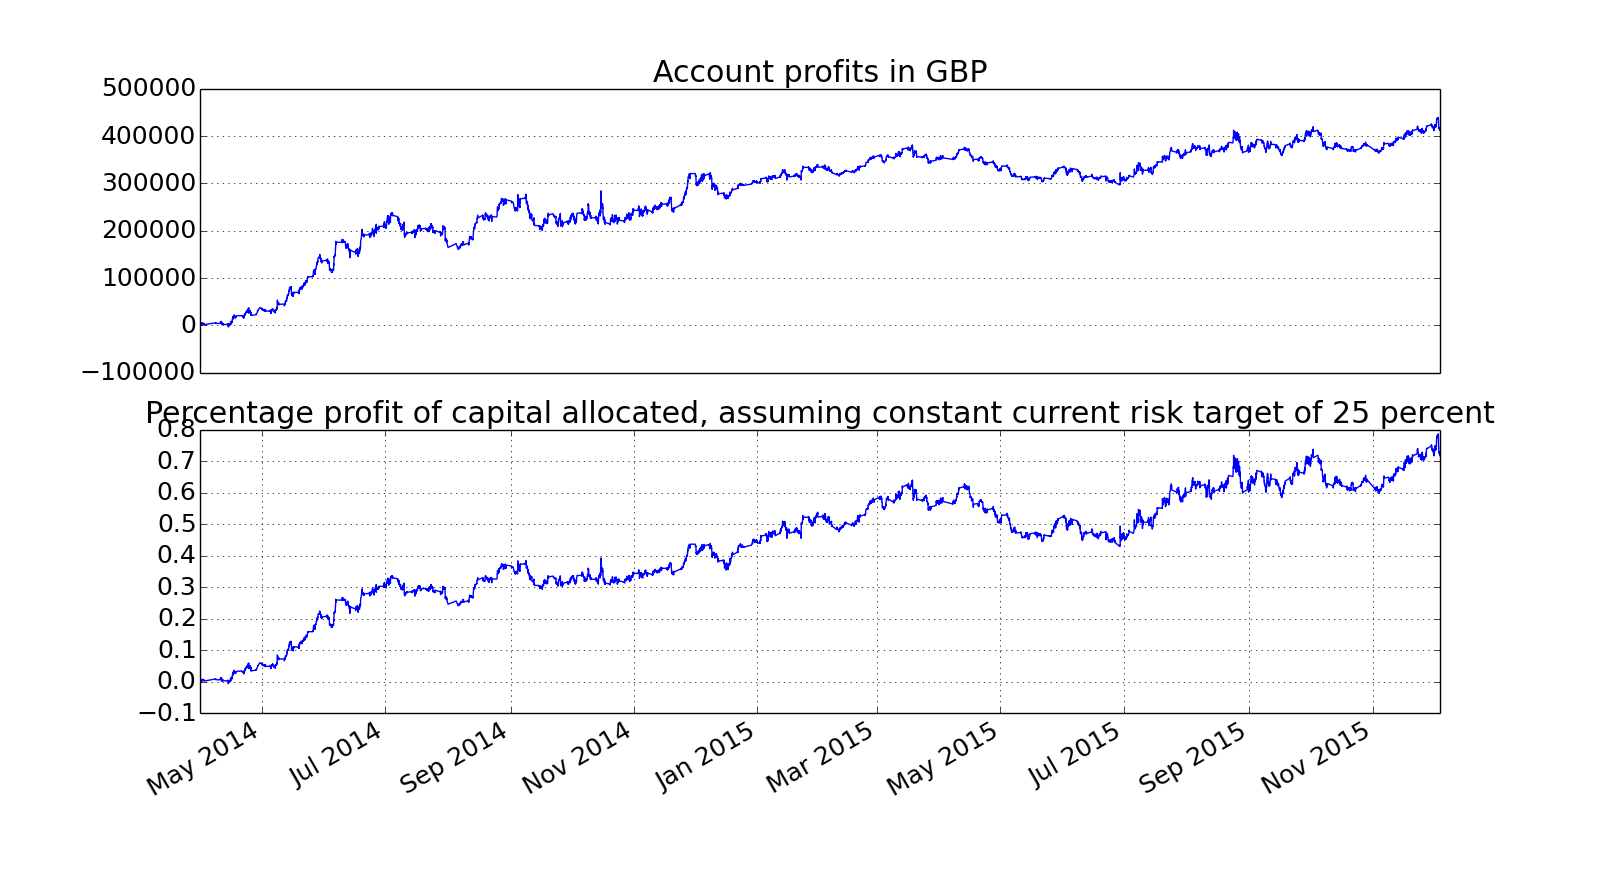
Another vote for diversification. Over the last few years the biggest money making sectors in trend following have been financials - equities, bonds, rates and vol; especially bonds. Last year in particular european bonds were an absolute barn stormer of a trade. In contrast many commodity hedge funds have shut their doors recently.
But over the last 30 days I've made nothing in bonds (actually small losses in European bonds, not big enough to trouble the figures above) but commodities have been wonderful. I hope the guy who posted on this thread saying 'why don't you just pick the best markets' is reading this.
(There is also a link here to the blog post I made on equity curve trading - again we're seeing that the returns of trend following systems tend to be negatively autocorrelated - bad follows good and vice versa, rather than the other way round...)
Positions:
Risk:
(there is some discreprancy in positions because I've closed long BTP, OAT and short EUR positions this morning; after my nightly risk report ran but before I generated the list of positions above)
Trades
Expected slippage £549; actual £499
Lots of rolls (its that time of year).
I said last time that I was putting off refactoring my code; well I've decided to put it off no longer and I've begun to rewrite everything in python 3, nicely factored, properly tested and documented, the plan being to release it open souce as I do it. I'm starting with the backtesting engine, since that is the part that is dodgiest, and also because with a good backtesting engine I can be more productive with my research.
I've also just got a contract to write a more accessible book, about portfolio construction and asset allocation; and I've agreed to contribute a chapter to a book on trading rules. So it will be a busy new year.
If you're in London next week I'm speaking at traders expo. If not, and if I'm not in touch on here again before then, merry christmas (or generic seasonal greetings to those of other faiths), happy new year (and again, if you're on a different calendar, many happy wishes for whatever significant dates fall between now and January 2nd on my calendar).
GAT
Up 12% of capital, or around £48K
Last month:
Longer term:
Well up to yesterday I was looking forward to telling you what a f**** genius I was, and actually posting at a HWM level for a change. Then Mr Draghi opened his big mouth and I dropped 4% very quickly indeed. Movements in european bonds were about 6-7 daily standard deviations (the much discussed Euro move was a mere 4). The system I use to manually alert me so I can check and filter large price movements triggered half a dozen times in a matter of minutes; normally it's a couple of months before each trigger.
It would have been even nastier but my hedged equity portfolio added a bit. Talking to friends last night in the CTA industry losses of 4% were fairly common (and I run at a higher vol target than most).
Still I'm still up for the week, and the month, so shouldn't really complain. You can barely see yesterdays move on the second set of charts above.
The real lesson here is that diversification and risk control are there exactly for this kind of situation. Which meant I could be relatively sanguine. Even I however find it hard not to be emotionally attached to day to day p&l. The difference is that it makes no difference whatsoever to the way my system trades, since I don't let my system know how bad or good I'm feeling
Drawdown: 6.2% (off yesterday morning's new HWM)
Gainers:
Copper 8200
Platinum 8125
Gold 6700
Gas 6000
Crude 4500
Pallad 3700
Livecow 2600
Losers:
Eurodollars -2000
NASDAQ -2400
SP500 -2500
Another vote for diversification. Over the last few years the biggest money making sectors in trend following have been financials - equities, bonds, rates and vol; especially bonds. Last year in particular european bonds were an absolute barn stormer of a trade. In contrast many commodity hedge funds have shut their doors recently.
But over the last 30 days I've made nothing in bonds (actually small losses in European bonds, not big enough to trouble the figures above) but commodities have been wonderful. I hope the guy who posted on this thread saying 'why don't you just pick the best markets' is reading this.
(There is also a link here to the blog post I made on equity curve trading - again we're seeing that the returns of trend following systems tend to be negatively autocorrelated - bad follows good and vice versa, rather than the other way round...)
Positions:
Code:
       code contractid  positions   Lock WrongContract InFwdNotRoll
1       AUD     201512          1  False         False        False
19      BTP     201603          2  False         False        False
3    COPPER     201603         -3  False         False        False
18     CORN     201612         -5  False         False        False
15  CRUDE_W     201612         -3  False         False        False
5   EDOLLAR     201906          1  False         False        False
16  EDOLLAR     201903          7  False         False        False
23  EUROSTX     201512        -13  False         False        False
22   GAS_US     201602         -4  False         False        False
10      GBP     201512         -1  False         False        False
0      GOLD     201602         -2  False         False        False
12      JPY     201512         -2  False         False        False
13      KR3     201512          7  False         False        False
2   LEANHOG     201606         -1  False         False        False
20  LIVECOW     201610         -2  False         False        False
9       MXP     201512         -2  False         False        False
7       OAT     201603          1  False         False        False
17   PALLAD     201603         -1  False         False        False
25     PLAT     201601         -3  False         False        False
6   SOYBEAN     201611          1  False         False        False
11    SP500     201512          1  False         False        False
4       US2     201603          3  False         False        False
21      US5     201603          1  False         False        False
24      V2X     201601          2  False         False        False
14      VIX     201601         -1  False         False        False
8     WHEAT     201612         -3  False         False        False
Risk:
Code:
Expected annual risk more than GBP6400 per year, GBP400 per day
       code  multisignal  expected_annual_risk  expected_annual_risk_per_contract  position  expected_annual_risk_rounded_pos

Shorts:
27      JPY        -12.7                  8441                               4071        -2                              8141
17      VIX        -10.5                  6982                               8252        -1                              8252
0      CORN        -12.9                  8602                               1960        -5                              9801
26      GBP        -13.4                  8910                               5591        -2                             11182
4     WHEAT        -17.7                 11795                               3839        -3                             11516
2   LIVECOW        -13.8                  9167                               5905        -2                             11811
25  EUR                 -13.1                  8712                              13394       -1                            13394
32   PALLAD        -27.7                 18387                              14223        -1                             14223
33     PLAT        -26.8                 17799                               6169        -3                             18508
35   GAS_US        -26.8                 17799                               4668        -4                             18673
31     GOLD        -31.7                 21045                               9617        -2                             19234
30   COPPER        -26.8                 17799                               7400        -3                             22199
34  CRUDE_W        -31.7                 21045                               8483        -3                             25448

Longs:
10      OAT         19.9                 13229                               5015         2                             10031
36  EDOLLAR         16.2                 10751                               1543         8                             12341
8       BTP         23.5                 15603                               5042         3                             15125
(there is some discreprancy in positions because I've closed long BTP, OAT and short EUR positions this morning; after my nightly risk report ran but before I generated the list of positions above)
Trades
Code:
         code contractid     filled_datetime  filledtrade  filledprice
7363      AEX     201511 2015-11-10 07:30:04           -1   465.600000
7309      AUD     201512 2015-11-06 13:58:23           -1     0.704900
7483      AUD     201512 2015-11-19 06:47:22            1     0.715200
7609      AUD     201512 2015-12-02 02:54:38            1     0.731200
7576     BOBL     201512 2015-12-01 08:20:06           -2   130.000000
7579     BOBL     201603 2015-12-01 08:20:06            2   131.580000
7672     BOBL     201603 2015-12-04 08:39:34           -2   130.670000
7297      BTP     201512 2015-11-06 07:36:20           -1   137.840000
7426      BTP     201512 2015-11-16 07:03:27            1   139.160000
7489      BTP     201512 2015-11-19 08:03:17            1   139.910000
7588      BTP     201512 2015-12-01 09:01:29           -3   140.590000
7591      BTP     201603 2015-12-01 09:01:29            3   138.970000
7675      BTP     201603 2015-12-04 08:43:09           -1   137.010000
7411      CAC     201511 2015-11-13 07:31:44           -1  4831.500000
7501   COPPER     201512 2015-11-23 12:12:21           -1     2.023500
7612   COPPER     201512 2015-12-02 12:02:38            2     2.063500
7615   COPPER     201603 2015-12-02 12:02:38           -2     2.067000
7627   COPPER     201512 2015-12-02 12:09:35            1     2.062500
7630   COPPER     201603 2015-12-02 12:09:35           -1     2.066000
7384     CORN     201612 2015-11-11 13:38:56           -1   391.250000
7471     CORN     201612 2015-11-17 13:33:00           -1   390.250000
7603  CRUDE_W     201612 2015-12-01 14:35:40           -1    48.340000
7312  EDOLLAR     201812 2015-11-06 14:03:04           -1    97.865000
7324  EDOLLAR     201812 2015-11-06 15:49:03           -1    97.830000
7327  EDOLLAR     201812 2015-11-06 17:52:36           -1    97.825000
7390  EDOLLAR     201812 2015-11-11 16:05:20           -1    97.825000
7453  EDOLLAR     201812 2015-11-17 11:25:55           -5    97.900000
7456  EDOLLAR     201903 2015-11-17 11:56:49            5    97.825000
7564  EDOLLAR     201906 2015-11-27 12:43:32            1    97.875000
7657  EDOLLAR     201903 2015-12-03 17:53:41           -1    97.835000
7645      EUR     201512 2015-12-03 14:23:41            1     1.079700
7666      EUR     201512 2015-12-04 03:09:40            1     1.092500
7300   GAS_US     201601 2015-11-06 12:02:15            1     2.517000
7504   GAS_US     201601 2015-11-23 12:23:50            1     2.249000
7507   GAS_US     201602 2015-11-23 12:23:50           -1     2.293000
7510   GAS_US     201601 2015-11-23 12:29:31            2     2.254000
7513   GAS_US     201602 2015-11-23 12:29:31           -2     2.298000
7516   GAS_US     201601 2015-11-23 12:35:04            1     2.255000
7519   GAS_US     201602 2015-11-23 12:35:04           -1     2.299000
7291      GBP     201512 2015-11-05 13:42:30           -1     1.525000
7294      GBP     201512 2015-11-06 06:16:28           -1     1.528600
7480      GBP     201512 2015-11-19 01:50:36            1     1.528400
7552      GBP     201512 2015-11-25 03:36:27           -1     1.510000
7669      GBP     201512 2015-12-04 03:24:32            1     1.512300
7288     GOLD     201512 2015-11-05 12:14:42           -1  1107.600000
7465     GOLD     201512 2015-11-17 11:35:05           -1  1078.800000
7495     GOLD     201512 2015-11-19 17:03:29            1  1083.000000
7555     GOLD     201512 2015-11-25 12:22:44           -1  1073.000000
7633     GOLD     201512 2015-12-02 12:15:19            3  1067.100000
7636     GOLD     201602 2015-12-02 12:15:19           -3  1066.700000
7648     GOLD     201602 2015-12-03 14:41:32            1  1056.700000
7441      JPY     201512 2015-11-17 01:31:53           -1     0.008112
7492      JPY     201512 2015-11-19 16:57:33            1     0.008150
7663      JPY     201512 2015-12-03 19:42:51            1     0.008167
7360    KOSPI     201512 2015-11-10 01:14:46           -1   248.100000
7336     KR10     201512 2015-11-09 01:12:40           -1   124.380000
7396     KR10     201512 2015-11-12 01:23:10           -1   123.900000
7348      KR3     201512 2015-11-09 02:10:32           -1   109.120000
7357      KR3     201512 2015-11-10 00:31:57           -1   109.130000
7402      KR3     201512 2015-11-12 01:26:09           -1   109.070000
7351  LEANHOG     201606 2015-11-09 15:48:20           -1    72.875000
7474  LEANHOG     201606 2015-11-17 14:03:03           -1    71.100000
7606  LEANHOG     201606 2015-12-01 16:16:39            1    75.075000
7420  LIVECOW     201610 2015-11-13 15:08:15           -1   124.575000
7321      MXP     201512 2015-11-06 15:36:13            1     0.059230
7405   NASDAQ     201512 2015-11-12 13:42:52           -1  4619.250000
7639   NASDAQ     201512 2015-12-02 14:29:52            1  4719.000000
7660   NASDAQ     201512 2015-12-03 18:00:40           -1  4621.000000
7477      OAT     201512 2015-11-18 07:03:30            1   153.830000
7486      OAT     201512 2015-11-19 07:05:39            1   154.150000
7582      OAT     201512 2015-12-01 08:31:38           -2   153.910000
7585      OAT     201603 2015-12-01 08:31:38            2   151.810000
7678      OAT     201603 2015-12-04 08:43:59           -1   150.000000
7378   PALLAD     201512 2015-11-11 11:46:34           -1   596.250000
7618   PALLAD     201512 2015-12-02 12:04:00            1   540.200000
7621   PALLAD     201603 2015-12-02 12:04:00           -1   540.450000
7303     PLAT     201601 2015-11-06 12:17:00           -1   954.300000
7414     PLAT     201601 2015-11-13 13:44:35           -1   868.600000
7366      SMI     201512 2015-11-10 07:33:43           -1  8900.000000
7570      SMI     201512 2015-11-30 13:57:39            1  9026.000000
7651      SMI     201512 2015-12-03 15:34:19           -1  8837.000000
7306  SOYBEAN     201611 2015-11-06 13:07:16           -1   875.250000
7369  SOYBEAN     201611 2015-11-11 11:34:12           -1   870.000000
7549  SOYBEAN     201611 2015-11-24 12:37:55            1   884.500000
7558  SOYBEAN     201611 2015-11-25 15:26:12            1   886.000000
7567  SOYBEAN     201611 2015-11-27 14:47:41            1   895.250000
7600  SOYBEAN     201611 2015-12-01 14:30:00            1   902.250000
7624  SOYBEAN     201611 2015-12-02 12:07:59            1   909.000000
7408    SP500     201512 2015-11-12 14:46:14           -1  2055.500000
7561    SP500     201512 2015-11-26 15:36:29            1  2095.000000
7318      US2     201512 2015-11-06 14:12:16           -1   109.007812
7498      US2     201512 2015-11-20 15:43:37            1   109.078125
7522      US2     201512 2015-11-23 14:04:12           -3   109.015625
7525      US2     201603 2015-11-23 14:04:12            3   108.726562
7315      US5     201512 2015-11-06 14:05:16           -1   118.664062
7573      US5     201603 2015-11-30 15:10:48            1   118.687500
7429      V2X     201512 2015-11-16 08:35:19           -4    23.500000
7432      V2X     201601 2015-11-16 08:35:19            4    25.200000
7546      V2X     201601 2015-11-24 09:17:10           -1    23.800000
7642      V2X     201601 2015-12-03 09:22:41           -1    22.400000
7447      VIX     201512 2015-11-17 09:29:54            1    17.750000
7450      VIX     201601 2015-11-17 09:58:30           -1    18.350000
7459    WHEAT     201612 2015-11-17 11:29:15           -1   518.000000
7462    WHEAT     201612 2015-11-17 11:30:28            1   518.750000
Expected slippage £549; actual £499
Lots of rolls (its that time of year).
I said last time that I was putting off refactoring my code; well I've decided to put it off no longer and I've begun to rewrite everything in python 3, nicely factored, properly tested and documented, the plan being to release it open souce as I do it. I'm starting with the backtesting engine, since that is the part that is dodgiest, and also because with a good backtesting engine I can be more productive with my research.
I've also just got a contract to write a more accessible book, about portfolio construction and asset allocation; and I've agreed to contribute a chapter to a book on trading rules. So it will be a busy new year.
If you're in London next week I'm speaking at traders expo. If not, and if I'm not in touch on here again before then, merry christmas (or generic seasonal greetings to those of other faiths), happy new year (and again, if you're on a different calendar, many happy wishes for whatever significant dates fall between now and January 2nd on my calendar).
GAT
Nice update, thank you.
If you get a chance, perhaps next time you update it would be good to know your thoughts on the recent AHL team co-authored paper (http://papers.ssrn.com/sol3/papers.cfm?abstract_id=2695101).
What's the response function stuff about in the momentum section of it?
Cheers,
Q1
If you get a chance, perhaps next time you update it would be good to know your thoughts on the recent AHL team co-authored paper (http://papers.ssrn.com/sol3/papers.cfm?abstract_id=2695101).
What's the response function stuff about in the momentum section of it?
Cheers,
Q1
Nice update, thank you.
If you get a chance, perhaps next time you update it would be good to know your thoughts on the recent AHL team co-authored paper (http://papers.ssrn.com/sol3/papers.cfm?abstract_id=2695101).
What's the response function stuff about in the momentum section of it?
Cheers,
Q1
Extreme values of momentum don't translate into larger trends (think - dead cat bounce)
I use a simple cap to get round this. However AHL use something where larger signals are actually downweighted.

The blue line shows the original signal; the red line applying the response function.
Note for very large signals (bigger than 1.5- AHL scale their forecasts so they have a standard deviation of 1.0) the forecast after applying a response is actually getting smaller as we get more confident.
There is some statistical evidence that this makes sense, but it is quite weak and doesn't seem to be around in every asset class or speed of momentum. Also it leads to weird behaviour - when a trend strengthens you start closing your position; then when it weakens again you open your position up before closing it again. Which is why I didn't keep this feature when I built my own system.
(Technical issue: you also need to make sure the distribution of the forecast after applying a response function is correct)
GAT
Hi, short question: is that a typo at the end of your trades list:
You are selling the same contract (Dec 2016) and buy it back one minute later? Or is it a roll and one of them is the Dec 2015 contract?
Another question: Do you decide on trades using the previous day settle/close price or the current price?
If latter, how do you avoid that the position signal is, e.g. 0.51 -> rounded to 1 so you buy one contract and soon after it drops to 0.49 again, forcing you to sell one contract?
Or do you only trade each contract once per day, ignoring all latter signals?
Thank you for your time answering questions (and your book, really good read).
Michael
Code:
7459 WHEAT 201612 2015-11-17 11:29:15 -1 518.000000
7462 WHEAT 201612 2015-11-17 11:30:28 1 518.750000
You are selling the same contract (Dec 2016) and buy it back one minute later? Or is it a roll and one of them is the Dec 2015 contract?
Another question: Do you decide on trades using the previous day settle/close price or the current price?
If latter, how do you avoid that the position signal is, e.g. 0.51 -> rounded to 1 so you buy one contract and soon after it drops to 0.49 again, forcing you to sell one contract?
Or do you only trade each contract once per day, ignoring all latter signals?
Thank you for your time answering questions (and your book, really good read).
Michael
Hi, short question: is that a typo at the end of your trades list:
Code:7459 WHEAT 201612 2015-11-17 11:29:15 -1 518.000000 7462 WHEAT 201612 2015-11-17 11:30:28 1 518.750000
You are selling the same contract (Dec 2016) and buy it back one minute later? Or is it a roll and one of them is the Dec 2015 contract?
Another question: Do you decide on trades using the previous day settle/close price or the current price?
If latter, how do you avoid that the position signal is, e.g. 0.51 -> rounded to 1 so you buy one contract and soon after it drops to 0.49 again, forcing you to sell one contract?
Or do you only trade each contract once per day, ignoring all latter signals?
Thank you for your time answering questions (and your book, really good read).
Michael
No it's really a sell and a buy.
In chapter 11 I describe how you wouldn't change your position unless the rounded position has moved by more than 10%. I use something similar to that, which has a similar effect.
I trade based on daily prices, but using the last price in day. Since I sample those more than once per day, it means there can potentially be edge cases where I will buy and sell in the same day. I can wait quite a long time for a fill to happen (hours if needed); long enough so that another price has come in and I change my mind about what position I want on within a minute.
All this is probably too complicated and I plan to switch to just using the previous days close in the next few months.
GAT
That's another thing that I did not fully understand: Only trading when the rounded positions differ more than 10% only makes a difference when the positions are greater than 10, I would think? Otherwise any difference is more than 10%.
Trading too often by mistake is one of the things that I try to avoid. My nightmare is a run away algo trading program that keeps buying and selling the same thing every minute or so, spending comissions and spread.
Trading too often by mistake is one of the things that I try to avoid. My nightmare is a run away algo trading program that keeps buying and selling the same thing every minute or so, spending comissions and spread.
That's another thing that I did not fully understand: Only trading when the rounded positions differ more than 10% only makes a difference when the positions are greater than 10, I would think? Otherwise any difference is more than 10%.
Trading too often by mistake is one of the things that I try to avoid. My nightmare is a run away algo trading program that keeps buying and selling the same thing every minute or so, spending comissions and spread.
You're right. That's why I use a slightly more complex method; but it is a bit involved to include in the book. I'll blog about it some day.
Agree with the nightmare. I have a lot of controls to limit the damage; for example I can't trade more than 5 wheat contracts a day.
GAT