You are using an out of date browser. It may not display this or other websites correctly.
You should upgrade or use an alternative browser.
You should upgrade or use an alternative browser.
Fully automated futures trading
- Thread starter globalarbtrader
- Start date
You said you have about 40 different instruments traded at all times. After you have a year of data, wouldn't it be wise to get ride of the worst performing 5-10 instruments and just keep the rest? 30 is still very well diversified....
Of course it is possible that those 5-10 futures just had a bad year, but would be interesting to see their back test what it shows in a longer time frame.
Interesting question. But this is a bad idea.... There isn't enough data in the backtest (at most 35 years, but on average about 15 years, and in some cases just 2 years) to prove statistically that instrument A is "probably" better than instrument B.
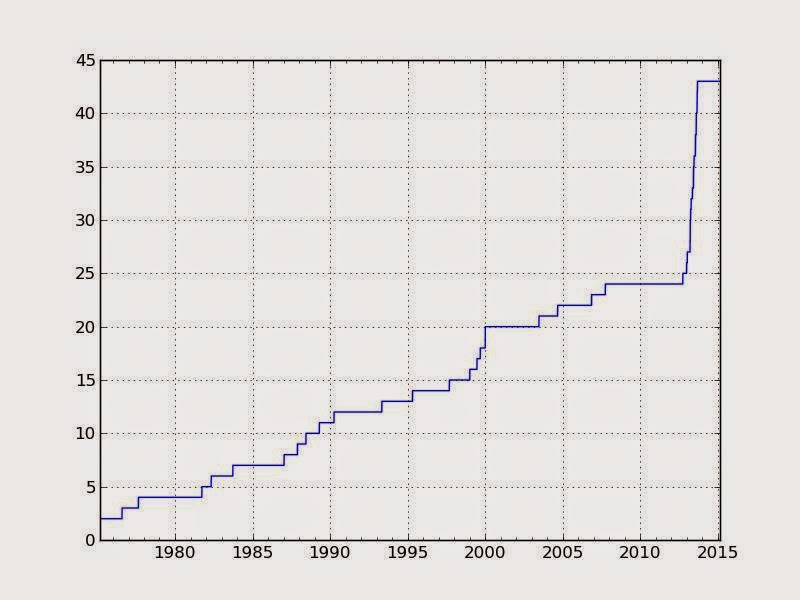
Number of instruments with data, by year. From http://qoppac.blogspot.co.uk/2015/03/simulating-my-futures-system.html
And this means one year of live trading data is wholly inadequate. This is because the differences in performance aren't sufficiently large to find a difference.
From table 6 of my forthcoming book given an average correlation between instruments of 0.5 I'd only need 8 years of data if one instrument had a Sharpe Ratio (SR) that was 1.0 higher than another (say a SR of 1.5 compared to one of 0.5). However there just aren't any instruments with that kind of SR difference over 8 years or more. More commonly the difference in performance is perhaps 0.5 or 0.25 SR units. With that kind of 'advantage' I'd need 25 years and 40 years of data respectively. I just don't have it.
GAT
Nice performance.
One option you forgot to mention is not to go away at all.
Ha! Yes forgot that one. But one of the nice advantages of being an independent trader is to go on holiday whenever you feel like it.....
GAT
But even 1 year data is like 250 trading days, that is a lots of data and statistically signifficant number. Also markets change over time, so just because the backtest worked in let's say 2006, that doesn't mean the strategy still works today with the same instrument.
I am curious about the breakdown of the 40 instruments as P/L goes? Let's say 10-15 very well performing, 15-20 so-so, and 10-15 losers. What is the point of carrying the loser?
Another question: How about correlated markets? Even if it is 2 futures, if they are strongly correlated, they can be treated as one. This is including inversely correlated markets too. Dollar/gold is such an example. The point here is that just because you have 40 instruments, you might only trade 25 uncorrelated markets or even less....
But even 1 year data is like 250 trading days, that is a lots of data and statistically signifficant number. Also markets change over time, so just because the backtest worked in let's say 2006, that doesn't mean the strategy still works today with the same instrument.
I am curious about the breakdown of the 40 instruments as P/L goes? Let's say 10-15 very well performing, 15-20 so-so, and 10-15 losers. What is the point of carrying the loser?
Another question: How about correlated markets? Even if it is 2 futures, if they are strongly correlated, they can be treated as one. This is including inversely correlated markets too. Dollar/gold is such an example. The point here is that just because you have 40 instruments, you might only trade 25 uncorrelated markets or even less....
The point of 'carrying the loser' is that you don't know in future which markets will be the losers, and which will be the winners. For this to be the case three things would have to be true:
- there would have to be some reason which explains why A is winning and B is losing (or it is just likely to be a statistical fluke). For the kind of trading I do, that's usually unlikely. For HFT stuff working on market microstructure with for example different priority rules and rebates it is more plausible.
- there wouldn't be any changes in this relative structure; eg the future would be exactly like the past. Even for HFT this is a stretch, because different players come into the market and change the way it works.
- there would have to be sufficient statistical evidence to show that market A was better than market B
So we're back to statistics again. It's not true that using daily data rather than say monthly or annual data will give you more statistical significance. This is because when you go down to daily data you increase the amount of noise. This exactly compensates for the increase in the number of data points (to be technical, both effects scale at square root of time, ignoring auto-correlation effects which don't make that much difference to the result).
As for 'it worked before but might not work today' I'm trading systems with a relatively slow holding period, at least by the febrile standards of this board. My base assumption is that they always work on all markets for all time. I will never have enough data to prove otherwise. I will never have enough data to prove that I should be trading something else. I will never have enough data to prove that they only work for certain markets.
You are correct that there is no point having 100% correlated markets. However it depends on how much capital you have as to whether you would bother with markets that are 75% correlated, or 99% correlated. All things being equal I'd rather have more markets than less. And with more capital I will be adding markets where the correlation is higher, than for someone with less capital (see http://www.elitetrader.com/et/index.php?threads/a-tale-of-two-positions.292751/#post-4147857 for more explanation on this point).
With enough capital to trade 40 markets, that's what I should do. If I went down to 15 markets by dropping the most correlated pairs I'd reduce my expected Sharpe Ratio by about 15%, or in money terms about £13,000 a year. Why would I voluntarily want to give that up?
(A minor point to make is that what matters is not the correlation between prices that matters, but between the returns of the trading subsystems. The correlation of the latter is lower, so the diversification effect of adding more instruments is higher than you might think)
GAT
There's a new post in my current series here: http://www.elitetrader.com/et/index...atic-trading-system-part-5-accounting.293403/
Please leave any constructive discussion at that thread
GAT
Please leave any constructive discussion at that thread
GAT
It's been about a month since my last update; I've actually been back from holiday a few days but a month is an easier reporting period to deal with.
I discussed in a previous post what action I should take whilst away. In the end I didn't do anything... and for nearly all the time I didn't have internet or even read a newspaper... I can hear you gasping.... why did I miss anything?!
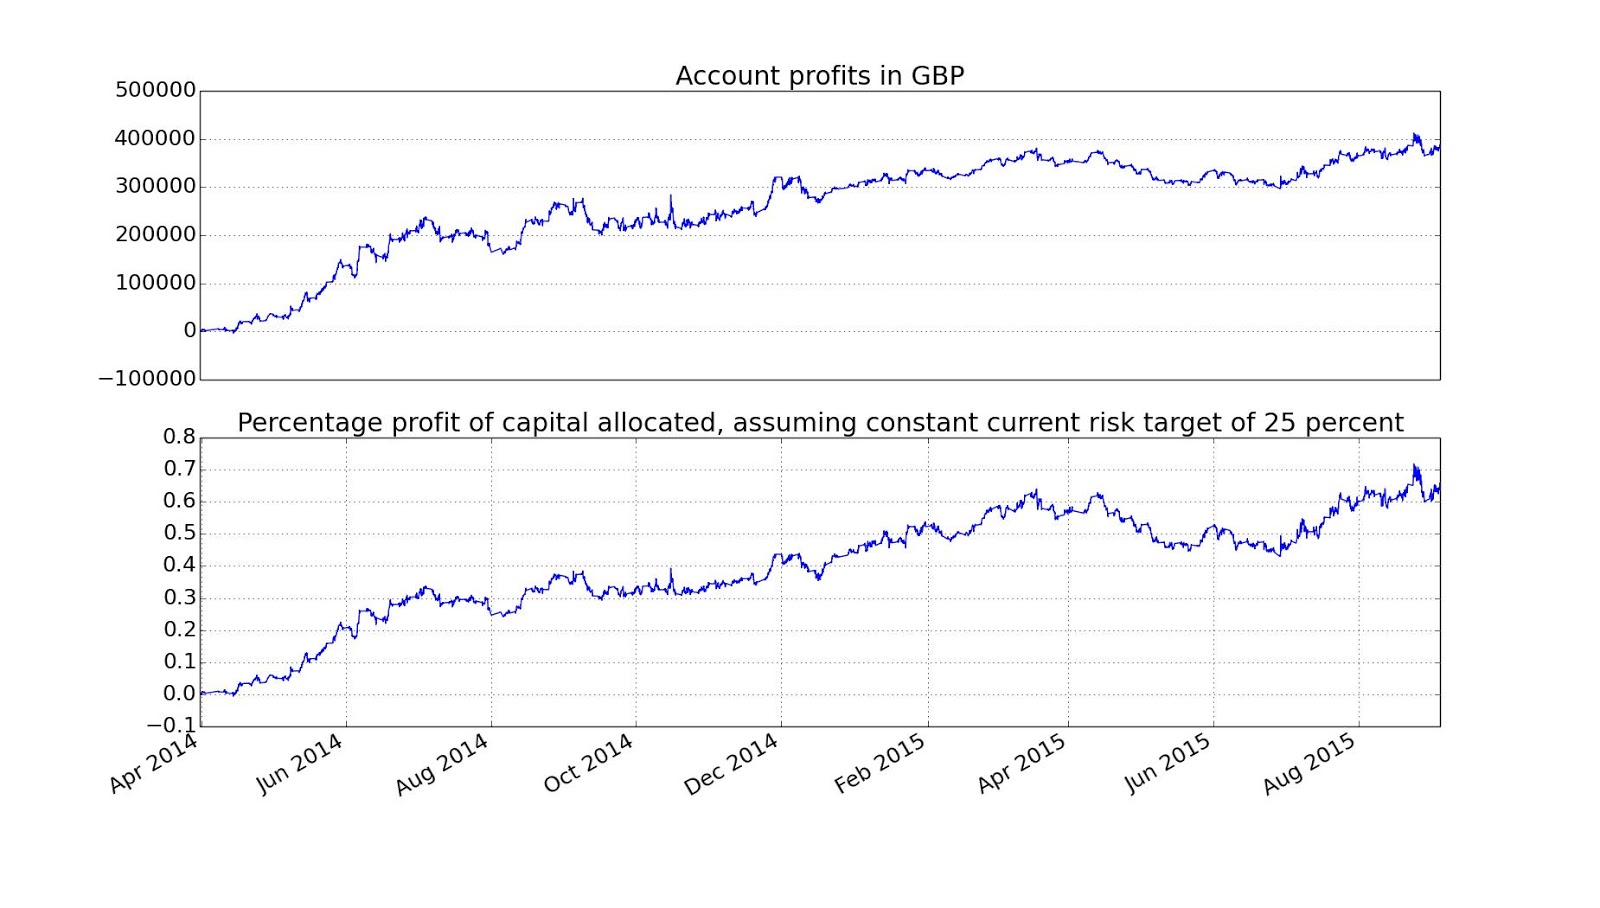
For most of the holiday not very much probably happened, but then with about a week to go apparently things got a little interesting. Net-Net on the moves of the last couple of weeks I'm flat or slightly up, but it has been a wild ride. I hit a new HWM when the equity market fell of a cliff, but gave most of it back on the recovery:
Anyway as of this morning my profit since the last update was around £20K. Current drawdown (off the new, higher HWM don't forget) is 6.9%
Gainers:
KOSPI £5400
MXP £3400
EDOLLAR £3700
PALLAD £3200
AUD £2900
KR3 £2500
Losers:
AEX -£2300
CAC -£2300
JPY -£5400
PLAT -£6900
GOLD -£7600
VIX -£12700
That big VIX loss wasn't really a surprise – I'd sold 3 contracts at a price of 16 or less, then it spiked above 20 very rapidly. Though I cut my position by then the damage was done. There is a similar story with Gold and everything else you can see here. This is why diversification is so important... even within the metals bucket I had radically different p&l. Referencing the discussion on here before, which of the metals should I choose to trade?
 Anyway as of this morning my profit since the last update was around £20K. Current drawdown (off the new, higher HWM don't forget) is 6.9%
Gainers:
KOSPI £5400
MXP £3400
EDOLLAR £3700
PALLAD £3200
AUD £2900
KR3 £2500
Losers:
AEX -£2300
CAC -£2300
JPY -£5400
PLAT -£6900
GOLD -£7600
VIX -£12700
That big VIX loss wasn't really a surprise – I'd sold 3 contracts at a price of 16 or less, then it spiked above 20 very rapidly. Though I cut my position by then the damage was done. There is a similar story with Gold and everything else you can see here. This is why diversification is so important... even within the metals bucket I had radically different p&l. Referencing the discussion on here before, which of the metals should I choose to trade? Same question for currencies?
Current positions
Current risk
Although I have fewer, and smaller, positions due to higher market vol the current expected portfolio risk as of last night was virtually unchanged @ 120% of average; on 90% of maximum capital (due to the drawdown) or in money terms £6768 a day or £108K a year.
Due to a smaller number of positions I am no longer hitting any risk limits (to put it another way, my exposure to correlation risk has fallen).
Trades
Slippage – expected £648, actual £421
A lot of rolls, but also just a lot of trading because of the markets wild swings. Even profitable positions like MXP had to be traded to adjust my risk as the turmoil affected it.
In other news I've published my final blog post on system construction, any discussion here please http://www.elitetrader.com/et/index...ed-trading-system-checks-and-balances.294024/
And for those who don't follow me on social media, you might not have seen the first review of my new book:
"A remarkable look inside systematic trading never seen before, spanning the range from small to institutional traders. This isn't only for algorithmic traders, it's valuable for anyone needing a structure - which is all of us. Carver explains how to properly test, apply constant risk, size positions and portfolios, and my favorite, his "no rule" trading rule, all explained with scenarios. Reading this will benefit all traders."
Perry Kaufman, author of Trading Systems and Methods.
I'm a massive fan of Perry, and very grateful for this endorsement.
The official release of the book is September 15th, but some of the people who pre-ordered the ebook have received their copies already.
Happy trading
GAT
I discussed in a previous post what action I should take whilst away. In the end I didn't do anything... and for nearly all the time I didn't have internet or even read a newspaper... I can hear you gasping.... why did I miss anything?!
For most of the holiday not very much probably happened, but then with about a week to go apparently things got a little interesting. Net-Net on the moves of the last couple of weeks I'm flat or slightly up, but it has been a wild ride. I hit a new HWM when the equity market fell of a cliff, but gave most of it back on the recovery:
Anyway as of this morning my profit since the last update was around £20K. Current drawdown (off the new, higher HWM don't forget) is 6.9%
Gainers:
KOSPI £5400
MXP £3400
EDOLLAR £3700
PALLAD £3200
AUD £2900
KR3 £2500
Losers:
AEX -£2300
CAC -£2300
JPY -£5400
PLAT -£6900
GOLD -£7600
VIX -£12700
That big VIX loss wasn't really a surprise – I'd sold 3 contracts at a price of 16 or less, then it spiked above 20 very rapidly. Though I cut my position by then the damage was done. There is a similar story with Gold and everything else you can see here. This is why diversification is so important... even within the metals bucket I had radically different p&l. Referencing the discussion on here before, which of the metals should I choose to trade?
Gainers:
KOSPI £5400
MXP £3400
EDOLLAR £3700
PALLAD £3200
AUD £2900
KR3 £2500
Losers:
AEX -£2300
CAC -£2300
JPY -£5400
PLAT -£6900
GOLD -£7600
VIX -£12700
That big VIX loss wasn't really a surprise – I'd sold 3 contracts at a price of 16 or less, then it spiked above 20 very rapidly. Though I cut my position by then the damage was done. There is a similar story with Gold and everything else you can see here. This is why diversification is so important... even within the metals bucket I had radically different p&l. Referencing the discussion on here before, which of the metals should I choose to trade? Same question for currencies?
Current positions
Code:
       code contractid  positions   Lock WrongContract InFwdNotRoll
1       AUD     201509         -3  False         False        False
5      BOBL     201512          3  False         False        False
23      BTP     201512          1  False         False        False
17   COPPER     201512         -2  False         False        False
18     CORN     201512         -3  False         False        False
11  CRUDE_W     201512         -1  False         False        False
21  EDOLLAR     201812         11  False         False        False
12  EUROSTX     201509        -13  False         False        False  (HEDGE)
3    GAS_US     201511         -4  False         False        False
7       GBP     201509         -3  False         False        False
10     KR10     201509          2  False         False        False
6       KR3     201509         11  False         False        False
0   LEANHOG     201606          1  False         False        False
19  LIVECOW     201610         -1  False         False        False
8       MXP     201509         -6  False         False        False
16      NZD     201509         -2  False         False        False
22   PALLAD     201512         -1  False         False        False
13     PLAT     201510         -2  False         False        False
14  SOYBEAN     201511         -2  False         False        False
2      US10     201512          1  False         False        False
4       US2     201512          3  False         False        False
20      US5     201512          1  False         False        False
15      V2X     201510          1  False         False        False
24      V2X     201511          1  False         False        False
25      VIX     201510         -1  False         False        False
9     WHEAT     201512         -3  False         False        False
Current risk
Code:
Expected annual risk more than GBP6400 per year, GBP400 per day
       code  multisignal  expected_annual_risk  expected_annual_risk_per_contract  position  expected_annual_risk_rounded_pos
17      VIX        -20.1                 13098                               9846        -1                              9846
0      CORN        -16.0                 10411                               3469        -3                             10406
29      NZD        -19.3                 12562                               6168        -2                             12337
28      MXP        -17.7                 11499                               2104        -6                             12624
4     WHEAT        -18.0                 11695                               4237        -3                             12710
26      GBP        -21.4                 13921                               4737        -3                             14210
34  CRUDE_W        -26.0                 16928                              14271        -1                             14271
33     PLAT        -16.7                 10837                               7345        -2                             14691
3   SOYBEAN        -22.3                 14538                               8074        -2                             16147
24      AUD        -22.6                 14719                               5384        -3                             16152
32   PALLAD        -21.6                 14078                              16835        -1                             16835
30   COPPER        -29.6                 19257                               9453        -2                             18907
35   GAS_US        -33.8                 21973                               5215        -4                             20860
36  EDOLLAR         24.2                 15720                               1294        11                             14229
Although I have fewer, and smaller, positions due to higher market vol the current expected portfolio risk as of last night was virtually unchanged @ 120% of average; on 90% of maximum capital (due to the drawdown) or in money terms £6768 a day or £108K a year.
Due to a smaller number of positions I am no longer hitting any risk limits (to put it another way, my exposure to correlation risk has fallen).
Trades
Code:
         code contractid     filled_datetime  filledtrade  filledprice
4741      AEX     201509 2015-08-06 13:17:37            1   500.200000
4777      AEX     201509 2015-08-13 07:56:45           -1   483.700000
4990      AUD     201509 2015-08-26 01:28:57           -1     0.710400
5086      AUD     201509 2015-09-03 03:31:48           -1     0.702000
4843     BOBL     201509 2015-08-17 07:28:42            1   130.510000
4927     BOBL     201509 2015-08-25 10:02:17           -3   130.470000
4930     BOBL     201512 2015-08-25 10:02:17            3   128.620000
4846      BTP     201509 2015-08-17 08:29:10            1   136.880000
4867      BTP     201509 2015-08-18 14:54:13           -1   136.480000
4912      BTP     201509 2015-08-25 09:36:09           -1   135.330000
5008      BTP     201509 2015-08-27 09:41:02           -1   134.880000
5011      BTP     201512 2015-08-27 09:41:02            1   133.200000
5014      BTP     201512 2015-08-27 09:45:49           -1   133.280000
5035      BTP     201512 2015-08-28 10:49:52            1   133.750000
5077      BTP     201512 2015-09-02 15:25:36           -1   132.710000
5113      BTP     201512 2015-09-03 15:24:02            1   133.640000
4822     BUND     201509 2015-08-14 07:30:53            1   155.040000
4957     BUND     201509 2015-08-25 13:02:24           -1   154.020000
4960     BUND     201512 2015-08-25 13:02:24            1   154.210000
4996     BUND     201512 2015-08-26 07:26:07           -1   153.980000
4783      CAC     201509 2015-08-13 07:59:42           -1  5005.500000
4999      CAC     201509 2015-08-26 07:59:04           -1  4494.000000
5017      CAC     201509 2015-08-27 10:00:17            1  4640.500000
4756   COPPER     201512 2015-08-10 13:07:10           -1     2.348000
4762   COPPER     201512 2015-08-10 16:15:42            1     2.398500
4810   COPPER     201512 2015-08-13 12:10:50           -1     2.347000
5029   COPPER     201512 2015-08-27 16:55:39            1     2.334500
4852     CORN     201512 2015-08-17 15:15:26           -1   375.250000
5074     CORN     201512 2015-09-02 14:30:00           -1   368.750000
4798  CRUDE_W     201512 2015-08-13 11:57:17           -1    46.150000
5032  CRUDE_W     201512 2015-08-27 17:00:54            1    43.400000
5071  CRUDE_W     201512 2015-09-02 14:12:30            1    47.020000
4807  EDOLLAR     201812 2015-08-13 12:04:23            1    97.705000
4831  EDOLLAR     201812 2015-08-14 12:03:57            1    97.710000
4873  EDOLLAR     201812 2015-08-19 12:00:30            1    97.700000
4945  EDOLLAR     201809 2015-08-25 11:58:50           -2    97.985000
4948  EDOLLAR     201812 2015-08-25 11:58:50            2    97.885000
5005  EDOLLAR     201812 2015-08-26 17:55:45            1    97.875000
4744      EUR     201509 2015-08-06 13:59:49           -1     1.088900
4753      EUR     201509 2015-08-10 01:28:17            1     1.096000
4801   GAS_US     201510 2015-08-13 11:59:15            1     2.934000
4849   GAS_US     201511 2015-08-17 12:14:52           -1     2.903000
4864   GAS_US     201511 2015-08-18 12:11:41           -1     2.847000
4882   GAS_US     201511 2015-08-19 17:52:57           -1     2.824000
4951   GAS_US     201510 2015-08-25 12:02:37            1     2.690000
4954   GAS_US     201511 2015-08-25 12:02:37           -1     2.768000
4750      GBP     201509 2015-08-07 01:46:12           -1     1.551000
4774      GBP     201509 2015-08-13 00:59:57            1     1.560800
4918      GBP     201509 2015-08-25 09:39:34            1     1.578900
4987      GBP     201509 2015-08-25 19:26:17           -1     1.568500
5023      GBP     201509 2015-08-27 15:52:25           -1     1.538500
5041      GBP     201509 2015-08-31 01:35:03           -1     1.542000
5083      GBP     201509 2015-09-03 01:34:12           -1     1.530000
4768     GOLD     201512 2015-08-11 12:07:07            1  1111.500000
4834     GOLD     201512 2015-08-14 12:14:54            1  1120.000000
4891     GOLD     201512 2015-08-20 12:14:06            1  1138.200000
4885      JPY     201509 2015-08-20 01:40:06            1     0.008076
4903      JPY     201509 2015-08-24 00:57:14            1     0.008216
4909      JPY     201509 2015-08-25 00:57:57            1     0.008411
4870    KOSPI     201509 2015-08-19 02:58:19           -1   233.850000
5038    KOSPI     201509 2015-08-31 01:01:27            1   230.350000
5131    KOSPI     201509 2015-09-04 02:36:39            1   229.200000
4894     KR10     201509 2015-08-21 01:40:29            1   124.320000
4840      KR3     201509 2015-08-17 01:47:50            1   109.340000
4897      KR3     201509 2015-08-21 02:00:22            1   109.450000
5128      KR3     201509 2015-09-04 01:46:33            1   109.610000
5116  LIVECOW     201510 2015-09-03 16:55:29            1   142.450000
5119  LIVECOW     201610 2015-09-03 16:55:29           -1   135.100000
4765      MXP     201509 2015-08-10 18:11:37            1     0.061870
4792      MXP     201509 2015-08-13 09:59:07           -1     0.061240
4855      MXP     201509 2015-08-18 02:24:11           -1     0.060690
4921      MXP     201509 2015-08-25 09:40:38            1     0.058530
4936      MXP     201509 2015-08-25 11:26:57            1     0.059000
4993      MXP     201509 2015-08-26 01:39:01           -1     0.057770
5026      MXP     201509 2015-08-27 16:17:41            1     0.059320
4858      OAT     201509 2015-08-18 07:32:41            1   149.860000
4876      OAT     201509 2015-08-19 15:21:25           -1   149.340000
4888      OAT     201509 2015-08-20 07:31:50            1   150.020000
4915      OAT     201509 2015-08-25 09:37:06           -1   149.010000
4963      OAT     201509 2015-08-25 13:08:30           -1   148.380000
4939   PALLAD     201509 2015-08-25 11:57:25            1   559.850000
5065   PALLAD     201509 2015-09-02 13:25:09            1   574.300000
5068   PALLAD     201512 2015-09-02 13:25:09           -1   574.900000
4879     PLAT     201510 2015-08-19 15:48:20            1  1008.400000
4942     PLAT     201510 2015-08-25 11:57:55            1   991.400000
4780      SMI     201509 2015-08-13 07:57:51           -1  9297.000000
4759  SOYBEAN     201511 2015-08-10 15:46:16            1   981.500000
4819  SOYBEAN     201511 2015-08-13 16:22:26           -1   913.500000
5002  SOYBEAN     201511 2015-08-26 12:21:49           -1   874.500000
4747    SP500     201509 2015-08-07 08:56:52           -1  2073.500000
4813     US10     201509 2015-08-13 15:33:12            1   127.671875
4966     US10     201509 2015-08-25 13:55:42           -1   128.656250
4969     US10     201512 2015-08-25 13:55:42            1   128.101562
4816      US2     201509 2015-08-13 15:38:40            1   109.476562
4972      US2     201509 2015-08-25 13:56:17           -3   109.687500
4975      US2     201512 2015-08-25 13:56:17            3   109.468750
4978      US5     201509 2015-08-25 13:57:13           -1   120.570312
4981      US5     201512 2015-08-25 13:57:13            1   120.179688
4984      US5     201512 2015-08-25 14:04:00            1   120.171875
5020      US5     201512 2015-08-27 14:07:59           -1   119.609375
4708      V2X     201509 2015-08-05 11:02:38           -1    19.500000
4711      V2X     201510 2015-08-05 11:02:38            1    19.900000
4738      V2X     201510 2015-08-06 08:11:06           -1    20.000000
4789      V2X     201510 2015-08-13 08:14:17           -1    20.700000
4933      V2X     201510 2015-08-25 10:38:30            1    23.850000
5047      V2X     201510 2015-08-31 09:08:46            1    26.000000
5137      V2X     201511 2015-09-04 08:22:25            1    27.300000
4714      VIX     201510 2015-08-05 11:04:33           -2    15.800000
4720      VIX     201509 2015-08-05 14:02:19            2    15.000000
4795      VIX     201510 2015-08-13 10:05:07           -1    16.000000
4924      VIX     201510 2015-08-25 10:02:31            1    20.550000
5062      VIX     201510 2015-08-31 11:00:07            1    22.800000
4861    WHEAT     201512 2015-08-18 12:02:26           -1   503.750000
5080    WHEAT     201512 2015-09-02 16:24:15           -1   477.000000
Slippage – expected £648, actual £421
A lot of rolls, but also just a lot of trading because of the markets wild swings. Even profitable positions like MXP had to be traded to adjust my risk as the turmoil affected it.
In other news I've published my final blog post on system construction, any discussion here please http://www.elitetrader.com/et/index...ed-trading-system-checks-and-balances.294024/
And for those who don't follow me on social media, you might not have seen the first review of my new book:
"A remarkable look inside systematic trading never seen before, spanning the range from small to institutional traders. This isn't only for algorithmic traders, it's valuable for anyone needing a structure - which is all of us. Carver explains how to properly test, apply constant risk, size positions and portfolios, and my favorite, his "no rule" trading rule, all explained with scenarios. Reading this will benefit all traders."
Perry Kaufman, author of Trading Systems and Methods.
I'm a massive fan of Perry, and very grateful for this endorsement.
The official release of the book is September 15th, but some of the people who pre-ordered the ebook have received their copies already.
Happy trading
GAT
A quiet couple of weeks after all the excitement in August.
As of this morning my loss since the last update was around £7K. Current draw down is 8.7%.
Gainers:
Crude oil £6K
Platinum £3.2K
Palladium £2.2K
KOSPI £1.4K
Yen £1.2K
Losers:
KR3 £1.2K
Live cow £1K
S&P 500 1.8K
Current positions:
Current risk:
My risk has fallen with the weakening of many trends; the current expected portfolio risk as of last night was virtually unchanged @ 90% of average; on 91% of maximum capital or in money terms £5162 a day or £83K a year.
Trades:
A lot of rolls.
Slippage £349 vs expected £473
GAT
As of this morning my loss since the last update was around £7K. Current draw down is 8.7%.
Gainers:
Crude oil £6K
Platinum £3.2K
Palladium £2.2K
KOSPI £1.4K
Yen £1.2K
Losers:
KR3 £1.2K
Live cow £1K
S&P 500 1.8K
Current positions:
Code:
       code contractid  positions   Lock WrongContract InFwdNotRoll
4      BOBL     201512          3  False         False        False
20      BTP     201512          2  False         False        False
14   COPPER     201512         -1  False         False        False
13     CORN     201612         -3  False         False        False
7   CRUDE_W     201512         -1  False         False        False
12  EDOLLAR     201903          3  False         False        False
17  EDOLLAR     201812         10  False         False        False
19  EUROSTX     201512        -13  False         False        False  (hedge)
1    GAS_US     201512         -1  False         False        False
2    GAS_US     201511         -4  False         False        False
11     KR10     201512          2  False         False        False
9       KR3     201512          9  False         False        False
0   LEANHOG     201606          2  False         False        False
15  LIVECOW     201610         -2  False         False        False
6       MXP     201512         -5  False         False        False
10      NZD     201512         -2  False         False        False
18   PALLAD     201512         -1  False         False        False
8      PLAT     201510         -2  False         False        False
3       US2     201512          2  False         False        False
16      US5     201512          1  False         False        False
21      V2X     201511          3  False         False        False
5     WHEAT     201612         -2  False         False        False
Current risk:
Code:
       code  multisignal  expected_annual_risk  expected_annual_risk_per_contract  position  expected_annual_risk_rounded_pos
4     WHEAT        -12.8                  8245                               4182        -2                              8363
28      MXP        -14.3                  9268                               1854        -5                              9268
0      CORN        -11.8                  7618                               3105        -3                              9315
2   LIVECOW        -14.4                  9323                               5256        -2                             10511
30   COPPER        -23.1                 14902                              10651        -1                             10651
29      NZD        -16.2                 10470                               6157        -2                             12314
32   PALLAD        -12.9                  8317                              13331        -1                             13331
33     PLAT        -23.5                 15199                               6668        -2                             13335
34  CRUDE_W        -19.8                 12799                              14363        -1                             14363
35   GAS_US        -35.9                 23175                               4853        -5                             24267

7      BOBL          9.9                  6421                               1859         3                              5576
1   LEANHOG         10.6                  6823                               3006         2                              6011
5      KR10          7.9                  5119                               3042         2                              6084
6       KR3          9.2                  5953                                705         9                              6349
8       BTP         20.9                 13506                               7393         2                             14786
36  EDOLLAR         27.0                 17431                               1446        13                             18799
My risk has fallen with the weakening of many trends; the current expected portfolio risk as of last night was virtually unchanged @ 90% of average; on 91% of maximum capital or in money terms £5162 a day or £83K a year.
Trades:
Code:
         code contractid     filled_datetime  filledtrade  filledprice
5164      AUD     201509 2015-09-08 16:23:20            1     0.701700
5218      AUD     201509 2015-09-10 06:56:38            1     0.701800
5221      AUD     201512 2015-09-10 06:56:38           -1     0.698450
5248      AUD     201509 2015-09-10 07:06:08            1     0.701800
5251      AUD     201512 2015-09-10 07:06:08           -1     0.698450
5323      AUD     201512 2015-09-14 01:29:59            1     0.707700
5437      AUD     201512 2015-09-16 07:41:01            1     0.712900
5113      BTP     201512 2015-09-03 15:24:02            1   133.640000
5152      BTP     201512 2015-09-07 07:34:06            1   134.390000
5371      BTP     201512 2015-09-15 11:40:02            1   134.780000
5428      BTP     201512 2015-09-15 15:58:34           -1   134.140000
5470   COPPER     201512 2015-09-18 16:07:57            1     2.383500
5404     CORN     201512 2015-09-15 14:35:56            3   393.500000
5407     CORN     201612 2015-09-15 14:35:56           -3   414.000000
5146  EDOLLAR     201812 2015-09-04 12:18:57            1    97.880000
5278  EDOLLAR     201903 2015-09-10 12:00:18            1    97.760000
5377  EDOLLAR     201903 2015-09-15 12:04:39            1    97.820000
5386  EDOLLAR     201903 2015-09-15 12:20:43            1    97.810000
5434  EDOLLAR     201812 2015-09-15 18:35:47           -1    97.810000
5461  EDOLLAR     201812 2015-09-18 12:13:41           -1    97.970000
5365  EUROSTX     201509 2015-09-15 08:02:02           13  3188.000000
5368  EUROSTX     201512 2015-09-15 08:02:02          -13  3175.000000
5473   GAS_US     201512 2015-09-18 18:18:02           -1     2.842000
5161      GBP     201509 2015-09-08 13:18:02            1     1.540400
5224      GBP     201509 2015-09-10 07:01:47            1     1.536500
5227      GBP     201512 2015-09-10 07:01:47           -1     1.535700
5266      GBP     201509 2015-09-10 07:58:28            1     1.536500
5269      GBP     201512 2015-09-10 07:58:28           -1     1.535700
5329      GBP     201512 2015-09-14 02:38:06            1     1.544800
5452      GBP     201512 2015-09-18 01:52:52            1     1.556400
5149     GOLD     201512 2015-09-04 14:20:48           -1  1117.100000
5281     GOLD     201512 2015-09-10 12:05:39           -1  1106.300000
5458     GOLD     201512 2015-09-18 12:05:03            1  1136.500000
5476     GOLD     201512 2015-09-21 12:04:49            1  1137.100000
5131    KOSPI     201509 2015-09-04 02:36:39            1   229.200000
5290     KR10     201512 2015-09-14 01:11:27            2   124.670000
5305     KR10     201512 2015-09-14 01:12:08            2   124.670000
5311     KR10     201512 2015-09-14 01:14:19            2   124.680000
5314     KR10     201512 2015-09-14 01:16:48            2   124.650000
5317     KR10     201512 2015-09-14 01:18:12            2   124.640000
5320     KR10     201509 2015-09-14 01:19:54           -2   124.790000
5335     KR10     201512 2015-09-14 06:30:13           -8   124.420000
5128      KR3     201509 2015-09-04 01:46:33            1   109.610000
5158      KR3     201509 2015-09-08 04:31:46           -1   109.580000
5215      KR3     201509 2015-09-10 02:30:37            1   109.630000
5296      KR3     201512 2015-09-14 01:03:19           11   109.570000
5299      KR3     201512 2015-09-14 01:07:45           11   109.570000
5302      KR3     201512 2015-09-14 01:10:46           11   109.570000
5308      KR3     201509 2015-09-14 01:12:30          -11   109.620000
5338      KR3     201512 2015-09-14 06:30:52          -21   109.520000
5449      KR3     201512 2015-09-18 01:45:36           -2   109.620000
5455      KR3     201512 2015-09-18 04:49:37           -1   109.650000
5176  LEANHOG     201606 2015-09-09 15:00:11            1    80.150000
5116  LIVECOW     201510 2015-09-03 16:55:29            1   142.450000
5119  LIVECOW     201610 2015-09-03 16:55:29           -1   135.100000
5479  LIVECOW     201610 2015-09-21 16:14:37           -1   131.375000
5167      MXP     201509 2015-09-08 16:54:46            1     0.059580
5236      MXP     201509 2015-09-10 07:04:38            2     0.059370
5239      MXP     201512 2015-09-10 07:04:38           -2     0.058970
5254      MXP     201509 2015-09-10 07:10:37            2     0.059370
5257      MXP     201512 2015-09-10 07:10:37           -2     0.058970
5260      MXP     201509 2015-09-10 07:15:41            1     0.059370
5263      MXP     201512 2015-09-10 07:15:41           -1     0.058970
5230      NZD     201509 2015-09-10 07:02:48            1     0.639200
5233      NZD     201512 2015-09-10 07:02:48           -1     0.635050
5242      NZD     201509 2015-09-10 07:05:07            1     0.639200
5245      NZD     201512 2015-09-10 07:05:07           -1     0.635050
5347      OAT     201512 2015-09-14 09:39:00            1   150.670000
5431      OAT     201512 2015-09-15 16:01:47           -1   149.600000
5389  SOYBEAN     201511 2015-09-15 12:33:19            1   886.000000
5392  SOYBEAN     201611 2015-09-15 12:33:19           -1   879.000000
5395  SOYBEAN     201511 2015-09-15 12:38:34            1   885.750000
5398  SOYBEAN     201611 2015-09-15 12:38:34           -1   878.750000
5401  SOYBEAN     201611 2015-09-15 12:48:31            1   878.500000
5464  SOYBEAN     201611 2015-09-18 12:30:07            1   882.000000
5446     US10     201512 2015-09-17 14:11:42           -1   126.640625
5467      US2     201512 2015-09-18 15:54:06           -1   109.382812
5137      V2X     201511 2015-09-04 08:22:25            1    27.300000
5275      V2X     201511 2015-09-10 08:12:02            1    27.500000
5341      V2X     201510 2015-09-14 08:35:17           -1    27.800000
5344      V2X     201511 2015-09-14 08:35:17            1    26.750000
5362      VIX     201510 2015-09-15 06:47:25            1    22.850000
5410    WHEAT     201512 2015-09-15 15:28:37            1   494.750000
5413    WHEAT     201612 2015-09-15 15:28:37           -1   533.000000
5416    WHEAT     201512 2015-09-15 15:43:22            1   495.500000
5419    WHEAT     201612 2015-09-15 15:43:22           -1   533.500000
5422    WHEAT     201512 2015-09-15 15:46:48            1   496.000000
5425    WHEAT     201612 2015-09-15 15:46:48           -1   534.000000
5440    WHEAT     201612 2015-09-16 15:59:10            1   526.250000
5443    WHEAT     201612 2015-09-16 16:04:28           -1   526.000000
A lot of rolls.
Slippage £349 vs expected £473
GAT
GAT,
Great post and great blog.
I have a few questions as I'm digesting all the info:
1. the 25% capital at risk is at 95% confidence (I believe I read that in one of your posts), and therefore 2 times the standard deviation of annual returns, correct? If I'm following correctly, then this means that the standard deviation of annual returns is 12.5% -- is this based on your backtesting results?
2. if my understanding in #1 above is correct, why do you not include the expected annual return in the equation of capital at risk? What I mean is, why is not capital at risk equal to expected maximum draw-down at 95% confidence -- in other words -- maximum_draw_down = mean_annual_return - 2 * annual_std_dev ?
3. I'm amazed by your graph (in prior post) showing the expected and actual risk. You mentioned that your "risk" calculations are based on standard deviation of the daily returns. I assume that the calculation of expected and actual risk is a measure of standard deviation of returns based on some look-back period, is that correct? If so, what is the duration of the look-back that you use?
BTW, I'm new to futures trading, actually never traded a single futures contract yet") I found your blog when I was looking for some info on the IB Gateway API -- it seemed amazing to me that there was no way to log in without the GUI -- I guess there isn't. I'm working on a futures trading system now, and I've been trading a tactical asset allocation system (using ETFs) for about 6 months. But that system is automated only up to the point of execution, it sends me emails of what to buy/sell and I do that part manually. The average holding period is about a month, so the burden is not big.
I found your blog when I was looking for some info on the IB Gateway API -- it seemed amazing to me that there was no way to log in without the GUI -- I guess there isn't. I'm working on a futures trading system now, and I've been trading a tactical asset allocation system (using ETFs) for about 6 months. But that system is automated only up to the point of execution, it sends me emails of what to buy/sell and I do that part manually. The average holding period is about a month, so the burden is not big.
Anyhow, I hope my questions make sense -- meaning that I've not misunderstood or misread your blog and this thread. Please keep in mind that I'm not questioning your methods in #2, I simply would like to understand why this is your approach and perhaps why the approach I mention in the question is not appropriate.
Now that I think about it, I am probably missing something. You mentioned that your Sharpe (or information ration since it does not include the risk-free rate) is roughly 0.9. If std. dev. of annual returns is 12.5%, then average annual return is roughly 11%. But I remember reading that you expect your system to produce about 16% annually. Sorry, I probably need to go back through some of your posts.
Thanks for your time and for making all this information available.
--Maciej
Great post and great blog.
I have a few questions as I'm digesting all the info:
1. the 25% capital at risk is at 95% confidence (I believe I read that in one of your posts), and therefore 2 times the standard deviation of annual returns, correct? If I'm following correctly, then this means that the standard deviation of annual returns is 12.5% -- is this based on your backtesting results?
2. if my understanding in #1 above is correct, why do you not include the expected annual return in the equation of capital at risk? What I mean is, why is not capital at risk equal to expected maximum draw-down at 95% confidence -- in other words -- maximum_draw_down = mean_annual_return - 2 * annual_std_dev ?
3. I'm amazed by your graph (in prior post) showing the expected and actual risk. You mentioned that your "risk" calculations are based on standard deviation of the daily returns. I assume that the calculation of expected and actual risk is a measure of standard deviation of returns based on some look-back period, is that correct? If so, what is the duration of the look-back that you use?
BTW, I'm new to futures trading, actually never traded a single futures contract yet
I found your blog when I was looking for some info on the IB Gateway API -- it seemed amazing to me that there was no way to log in without the GUI -- I guess there isn't. I'm working on a futures trading system now, and I've been trading a tactical asset allocation system (using ETFs) for about 6 months. But that system is automated only up to the point of execution, it sends me emails of what to buy/sell and I do that part manually. The average holding period is about a month, so the burden is not big. Anyhow, I hope my questions make sense -- meaning that I've not misunderstood or misread your blog and this thread. Please keep in mind that I'm not questioning your methods in #2, I simply would like to understand why this is your approach and perhaps why the approach I mention in the question is not appropriate.
Now that I think about it, I am probably missing something. You mentioned that your Sharpe (or information ration since it does not include the risk-free rate) is roughly 0.9. If std. dev. of annual returns is 12.5%, then average annual return is roughly 11%. But I remember reading that you expect your system to produce about 16% annually. Sorry, I probably need to go back through some of your posts.
Thanks for your time and for making all this information available.
--Maciej
GAT,
Great post and great blog.
I have a few questions as I'm digesting all the info:
1. the 25% capital at risk is at 95% confidence (I believe I read that in one of your posts), and therefore 2 times the standard deviation of annual returns, correct? If I'm following correctly, then this means that the standard deviation of annual returns is 12.5% -- is this based on your backtesting results?
It's absolutely fine to ask these questions, and hopefully I can clear up your confusion.
The long run target expected average standard deviation of my annual returns is 25% - that is what I mean by 'risk'. The amount of capital I have at risk is £400,000; so the long run expected blah blah is £100K a year.
I should get slightly less than this in my backtest, as I have an exogenous risk overlay that reduces my risk when it is particularly vunerable to tail events. However over short periods of my backtest I will obviously have expected risk different from the target; eithier because my forecasts are weak or strong, or because correlations are different from their long run average.
I'm trying to remember where I used a 95% confidence interval; perhaps relating to a t-test around what the distribution of my returns should be, but I don't think I've ever used it in the context of risk. If so apologies. More likely I've mentioned VAR in passing - but to be clear I don't use VAR and in any case VAR would normally be quoted as a daily measure.
2. if my understanding in #1 above is correct, why do you not include the expected annual return in the equation of capital at risk? What I mean is, why is not capital at risk equal to expected maximum draw-down at 95% confidence -- in other words -- maximum_draw_down = mean_annual_return - 2 * annual_std_dev ?
The maximum drawdown at 95% confidence is path dependent and so can't just be calculated from the expected annual standard deviation. I think your equation would give the 95% confidence interval for expected annual loss if targeted risk was constant (i.e. it wouldn't make sense for trend following or for someone using the kelly criteria to scale capital at risk).
Still for fun, if we assume my SR is 0.9 as in the backtest, then we get 0.9 x 25% - 2 * 25% or perhaps if we factor out the expected standard deviation 25% x (0.9 - 2) = 28%. That is probably a little conservative but worth bearing in mind.
FWIW the DAILY equivalent of that formula makes a lot more sense; daily 1.5625% x (0.05625 - 2); or about 3%. Note this is the same as a 95% VAR if you assume gaussian returns. If you put a gun to my head then I'd say my 95% VAR was probably about 4% on average.
Due to jump effects and so on I'd say that 3% isn't sufficiently conservative and the 95% daily loss is probably a little worse than that in reality.
3. I'm amazed by your graph (in prior post) showing the expected and actual risk. You mentioned that your "risk" calculations are based on standard deviation of the daily returns. I assume that the calculation of expected and actual risk is a measure of standard deviation of returns based on some look-back period, is that correct? If so, what is the duration of the look-back that you use?
I use a lookback of about one month for measuring standard deviations, and a longer lookback of about 6 month for correlations (and using weekly returns).
Now that I think about it, I am probably missing something. You mentioned that your Sharpe (or information ration since it does not include the risk-free rate) is roughly 0.9. If std. dev. of annual returns is 12.5%, then average annual return is roughly 11%. But I remember reading that you expect your system to produce about 16% annually. Sorry, I probably need to go back through some of your posts.
Yes to reiterate my std. dev of annual returns is 25% (or a little lower in backtest), as I'm a little conservative I don't expect to see a SR of 0.9, so 16% is probably a reasonable figure for expectations.
GAT