Hi GAT,
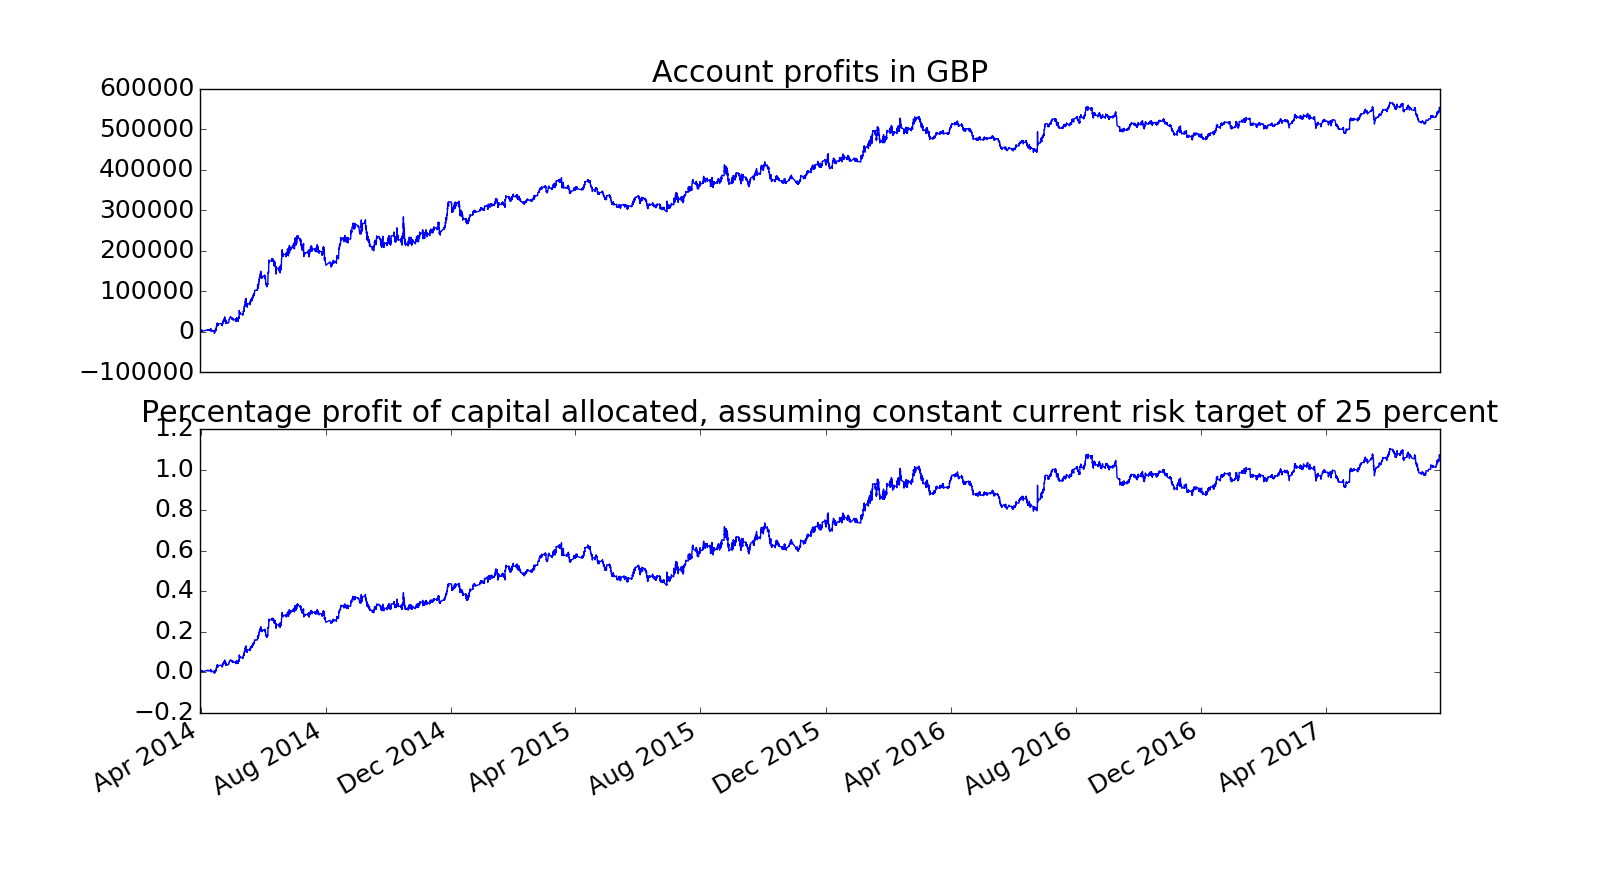
Great journal, have you ever posted a more up to date graphic equity chart.
The one in your opening post was from April 2014 to Feb 2015.
Would be nice to see one from April 2014 to say the end of June 2017.
There have been other charts, though I think the last one was in April 2017.
I'll try and post one at the weekend
GAT