It's a year of data. That is wholly insufficient to make any kind of meaningful judgement.
GAT
Yes,i know.I have a similar DD for about 4 years of data.2011 - 2015.Is it too small too?
It's a year of data. That is wholly insufficient to make any kind of meaningful judgement.
GAT
Yes,i know.I have a similar DD for about 4 years of data.2011 - 2015.Is it too small too?
What exactly are you looking for out of this conversation? Do you want affirmation that this is a good strategy? Is this something you've been trading yourself? Is it a backtest, or with real money?
To use an analogy I feel like you've emailed me [a total stranger] a picture of a car, with no other information, and asked me what I think of the car. I don't know if you want to buy the car (in which case I'd need a lot more information before I felt able to give you any decent advice) or you just want me to pat you on the back and say "great car" (which isn't something I'd do anyway).
GAT
Two month report
Overall the trend is up... but bumpy. A new HWM was set in early August.
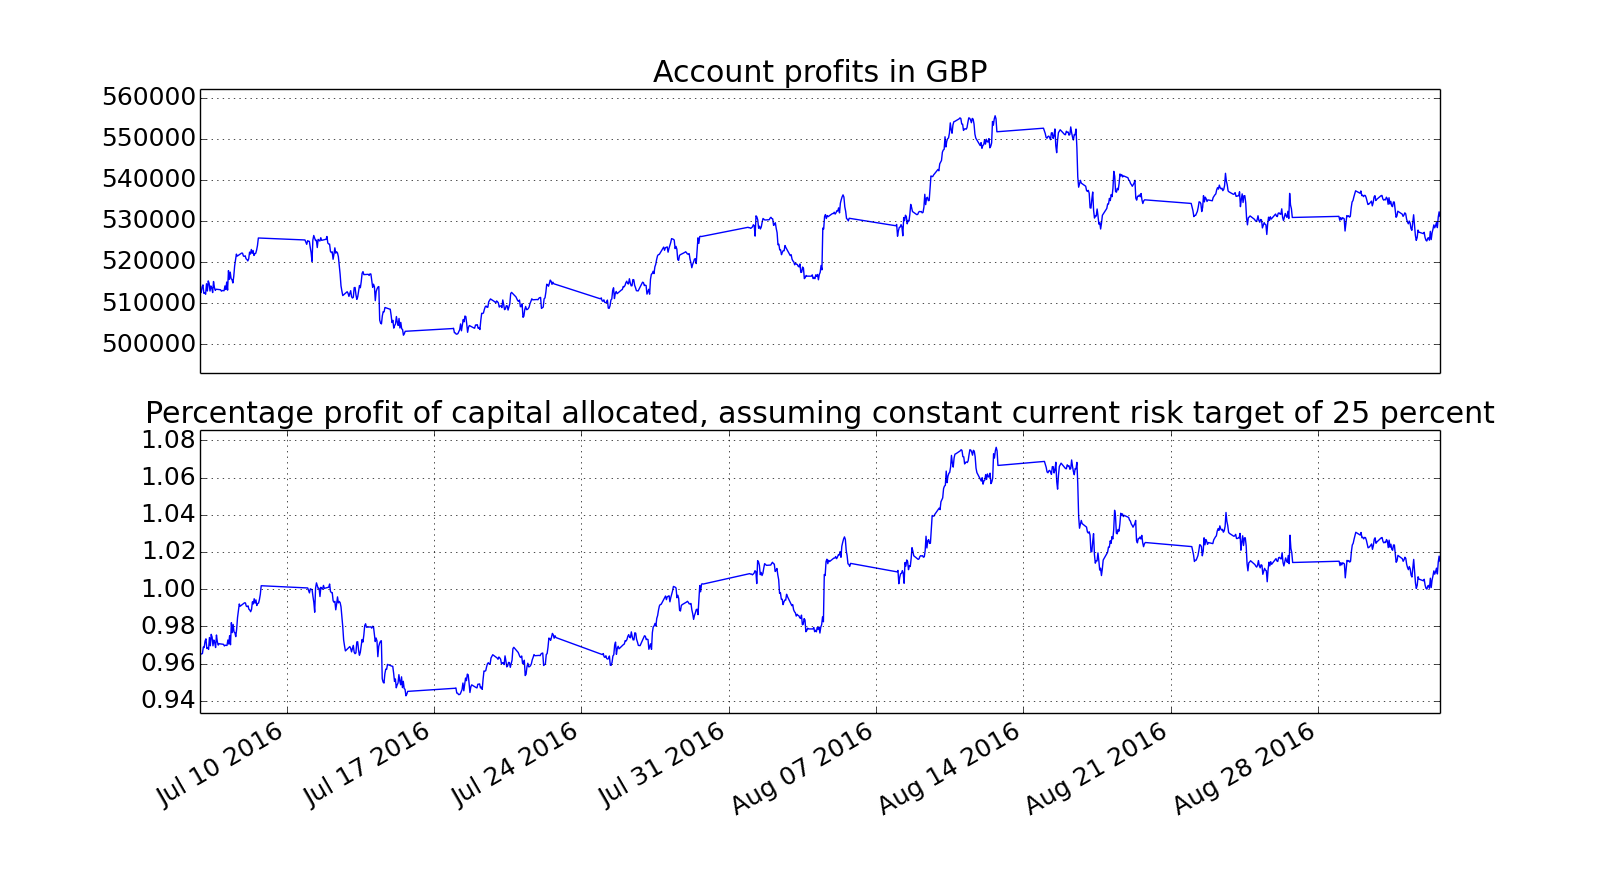
Since inception
P&L period: 5.9%
P&L to date: 101.5%
Drawdown (new HWM): 6.1%
Generally trend following CTA's did badly in August (see here); I was slightly up in my traditional futures portfolio and made pretty much all my money in the stocks + hedge portfolio. A lot of positions lost money across the board with only a few winners netting them out.
P&L:
Stock futures plus hedge: +22K
Wheat: +8.8K
Nasdaq: +2.3K
Palladium +2.2K
Soybean: -8.8K
Eurodollar: -4.7K
Gas: -4.6K
Gold: -4.0K
Hogs: -3K
KR10: -2.8K
KR3: -2.7K
Oat: -2.4K
Positions
Code:code contractid positions Lock WrongContract InFwdNotRoll 4 AEX 201609 1 False False False 21 BOBL 201609 3 False False False 9 BTP 201609 1 False False False 6 BUND 201609 1 False False False 18 CAC 201609 1 False False False 16 COPPER 201612 -1 False False False 2 CORN 201612 -4 False False False 5 EDOLLAR 201909 9 False False False 11 EUROSTX 201609 -9 False False False (equity hedge) 8 GOLD 201612 -1 False False False 10 KR10 201609 1 False False False 14 KR3 201609 10 False False False 0 LEANHOG 201706 1 False False False 20 MXP 201609 1 False False False 15 NZD 201609 2 False False False 1 OAT 201609 2 False False False 19 SOYBEAN 201611 -2 False False False 17 US10 201612 1 False False False 3 US2 201612 2 False False False 13 V2X 201610 -10 False False False 12 VIX 201610 -3 False False False 7 WHEAT 201612 -5 False False False
Risk
Code:code multisignal expected_annual_risk expected_annual_risk_per_contract position expected_annual_risk_rounded_pos 28 MXP 0.9 683 2447 1 2447 13 US2 4.6 3465 1503 2 3005 1 LEANHOG 4.3 3236 3570 1 3570 12 US10 3.8 2871 4399 1 4399 5 KR10 5.2 3993 2598 2 5195 7 BOBL 7.5 5701 1848 3 5543 6 KR3 7.6 5785 587 10 5866 20 CAC 4.6 3496 5961 1 5961 9 BUND 8.3 6336 6368 1 6368 23 SP500 2.4 1848 7214 1 7214 10 OAT 12.9 9833 5272 2 10544 19 AEX 9.7 7360 10665 1 10665 8 BTP 11.5 8759 5578 2 11155 29 NZD 13.8 10487 5852 2 11704 36 EDOLLAR 15.7 11968 1448 9 13034 16 V2X -12.3 9344 885 -10 8847 31 GOLD -13.9 10539 11810 -1 11810 0 CORN -15.7 11974 2963 -4 11851 17 VIX -19.4 14754 4699 -3 14096 4 WHEAT -25.9 19673 3773 -5 18865 3 SOYBEAN -25.0 19033 9643 -2 19285
Running at about 80% of average risk... similar level as it's been for a while.
Trades
Code:code contractid filled_datetime filledtrade filledprice 12550 AEX 201608 2016-08-10 12:59:07 1 451.550000 12643 AEX 201609 2016-08-17 14:15:38 1 447.350000 12652 AEX 201609 2016-08-17 14:29:07 1 447.400000 12655 AEX 201608 2016-08-17 14:41:12 -1 446.850000 12670 AEX 201609 2016-08-18 08:01:49 -1 450.350000 12736 AEX 201609 2016-08-26 08:37:42 -1 448.600000 12769 AEX 201609 2016-08-30 08:04:56 1 453.800000 12544 AUD 201609 2016-08-09 13:30:06 1 0.764700 12682 AUD 201609 2016-08-22 07:13:08 -1 0.758900 12745 AUD 201609 2016-08-29 02:47:38 -1 0.753400 12526 BOBL 201609 2016-08-04 13:27:30 1 133.570000 12565 BTP 201609 2016-08-11 22:27:00 1 144.820000 12580 BTP 201609 2016-08-12 13:22:34 1 145.990000 12748 BTP 201609 2016-08-29 07:36:12 -1 145.250000 12766 BTP 201609 2016-08-30 07:47:35 1 145.650000 12790 BTP 201609 2016-09-01 07:51:08 -1 145.380000 12805 BTP 201609 2016-09-02 07:50:34 -1 144.940000 12568 CAC 201609 2016-08-11 22:29:54 1 4460.000000 12571 CAC 201608 2016-08-11 22:34:51 1 4460.000000 12574 CAC 201609 2016-08-11 22:35:53 -1 4460.000000 12649 CAC 201609 2016-08-17 14:16:49 1 4430.500000 12664 CAC 201608 2016-08-17 17:01:02 -1 4430.500000 12685 CAC 201609 2016-08-22 13:11:59 -1 4386.500000 12772 CAC 201609 2016-08-30 09:08:39 1 4468.500000 12811 COPPER 201612 2016-09-02 18:10:51 -1 2.078500 12592 CORN 201612 2016-08-12 14:36:45 -1 332.000000 12763 CORN 201612 2016-08-29 15:27:53 -1 322.250000 12616 CRUDE_W 201612 2016-08-15 12:43:22 1 46.550000 12541 EDOLLAR 201906 2016-08-08 16:44:22 -1 98.720000 12589 EDOLLAR 201906 2016-08-12 14:05:29 -1 98.820000 12535 GAS_US 201610 2016-08-08 12:25:13 1 2.766000 12553 GAS_US 201610 2016-08-10 13:12:15 -1 2.687000 12577 GAS_US 201611 2016-08-12 13:16:48 -1 2.808000 12724 GAS_US 201610 2016-08-24 13:05:10 1 2.786000 12730 GAS_US 201611 2016-08-25 16:03:43 1 3.001000 12595 GBP 201609 2016-08-15 01:05:03 -1 1.291700 12637 GBP 201609 2016-08-17 02:04:21 1 1.305500 12775 GOLD 201612 2016-08-30 19:20:22 -1 1315.800000 12781 GOLD 201612 2016-08-31 12:07:43 -1 1317.400000 12784 GOLD 201612 2016-08-31 12:16:33 1 1316.400000 12625 KOSPI 201609 2016-08-16 01:36:26 1 258.100000 12733 KOSPI 201609 2016-08-26 05:12:03 -1 256.600000 12634 KR10 201609 2016-08-17 01:42:25 -1 133.260000 12802 KR10 201609 2016-09-02 02:43:52 -1 132.020000 12715 KR3 201609 2016-08-24 05:28:52 1 111.070000 12667 MXP 201609 2016-08-18 12:16:56 1 0.055130 12676 MXP 201609 2016-08-18 12:31:10 -1 0.055140 12619 NASDAQ 201609 2016-08-15 14:05:59 1 4812.250000 12661 NASDAQ 201609 2016-08-17 16:09:56 -1 4783.750000 12799 NASDAQ 201609 2016-09-01 15:01:12 -1 4775.000000 12688 NZD 201609 2016-08-22 15:13:14 1 0.726800 12547 OAT 201609 2016-08-10 12:54:09 1 161.880000 12640 OAT 201609 2016-08-17 14:11:41 -1 161.100000 12751 PALLAD 201609 2016-08-29 12:05:11 -1 686.850000 12754 PALLAD 201612 2016-08-29 12:05:11 1 688.300000 12778 PALLAD 201612 2016-08-31 12:01:13 -1 684.400000 12586 PLAT 201610 2016-08-12 13:39:25 -1 1156.000000 12727 PLAT 201610 2016-08-24 15:51:47 -1 1083.400000 12562 SMI 201609 2016-08-11 22:23:21 1 8260.000000 12658 SMI 201609 2016-08-17 16:08:54 -1 8142.000000 12631 SOYBEAN 201611 2016-08-16 13:41:46 1 1012.500000 12757 SOYBEAN 201611 2016-08-29 12:45:34 -1 962.750000 12787 SOYBEAN 201611 2016-08-31 18:45:23 -1 944.500000 12808 SP500 201609 2016-09-02 14:04:40 -1 2175.000000 12694 US10 201609 2016-08-23 14:04:11 -1 132.218750 12697 US10 201612 2016-08-23 14:04:11 1 131.234375 12700 US2 201609 2016-08-23 14:04:56 -2 109.312500 12703 US2 201612 2016-08-23 14:04:56 2 109.242188 12706 US5 201609 2016-08-23 14:05:56 -1 121.492188 12709 US5 201612 2016-08-23 14:05:56 1 121.500000 12760 US5 201612 2016-08-29 14:23:20 -1 121.046875 12538 V2X 201609 2016-08-08 13:22:15 -1 22.250000 12583 V2X 201610 2016-08-12 13:26:22 -1 23.250000 12598 V2X 201609 2016-08-15 08:04:25 1 21.850000 12601 V2X 201610 2016-08-15 08:04:25 -1 23.100000 12604 V2X 201609 2016-08-15 08:24:00 3 21.550000 12607 V2X 201610 2016-08-15 08:24:00 -3 23.250000 12628 V2X 201610 2016-08-16 08:18:29 -1 23.600000 12679 V2X 201610 2016-08-19 08:29:10 -1 24.200000 12721 V2X 201610 2016-08-24 09:44:00 -1 24.050000 12796 V2X 201610 2016-09-01 08:45:57 -1 23.600000 12610 VIX 201609 2016-08-15 10:03:38 2 14.780000 12613 VIX 201610 2016-08-15 10:03:38 -2 16.480000 12691 VIX 201610 2016-08-23 10:05:52 -1 16.650000 12622 WHEAT 201612 2016-08-15 18:06:54 -1 437.750000 12739 WHEAT 201612 2016-08-26 14:45:38 -1 421.500000 12742 WHEAT 201612 2016-08-26 19:07:00 1 406.250000
Expected slippage: £358
Actual: £344
A very small saving this month. One trade 12775 (Gold) cost me £116 in slippage. Any trading algo is a negative skew strategy; lots of small profits when it gets filled passively; big losses when the market runs away from it.
I've started rolling and this will continue over the next few weeks.
GAT
Looking at your latest and previous profit accounts, it looks to me the gains in your Stock futures plus hedge position were a significant part of your overall profits and to a large part driven by GBP weakness in the last 2 years (do correct me if any of this is not right). Doesn`t that mean you are running too much "uncontrolled" risk via GBP exposure if indeed the profits of your hedged equities are a significant part of your overall portfolio? I suspect by design you expect to make almost all of your money from the automated futures system, right?
itb
He`s gambling against his stop losses.That`s what he does,i think.
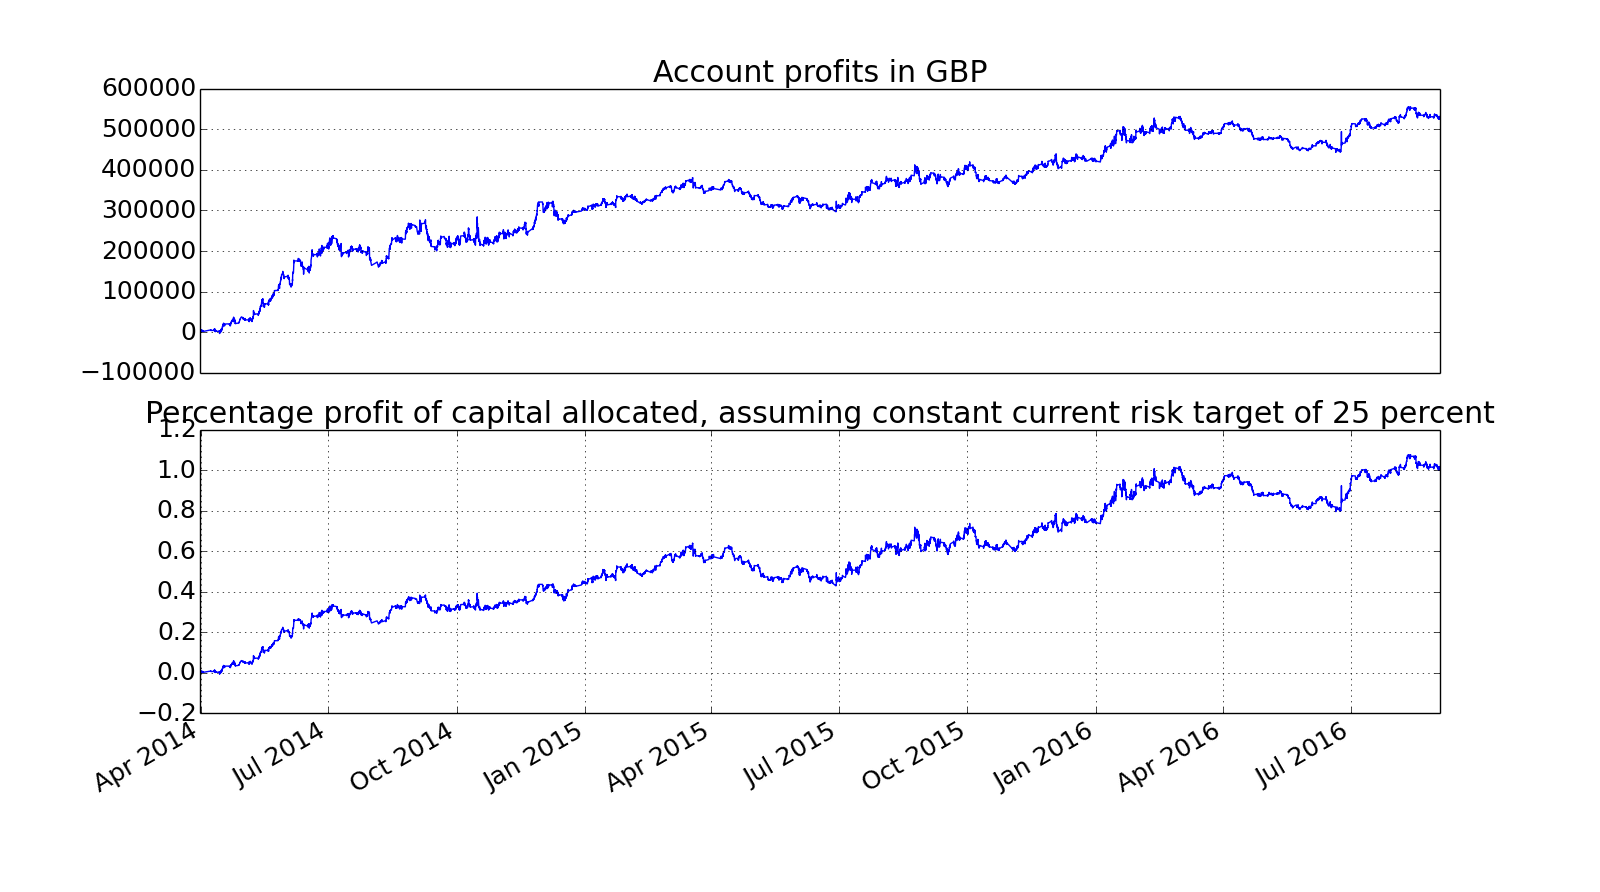
Out of interest I just checked the p&l for the current (incomplete) year. I made about 9.5% of my notional capital in stocks + hedges (of which maybe 3% was currency related, the rest prices), and lost about 5% in my futures account. So over the full period I'm up to a profit of about 101% of which about a quarter is coming from the stocks and hedges.
GAT