Hi Rob,
I have tried numerous variations to get around the high correlation between the EWMAC and breakout systems, but to no avail. Do you have any insight you can provide?
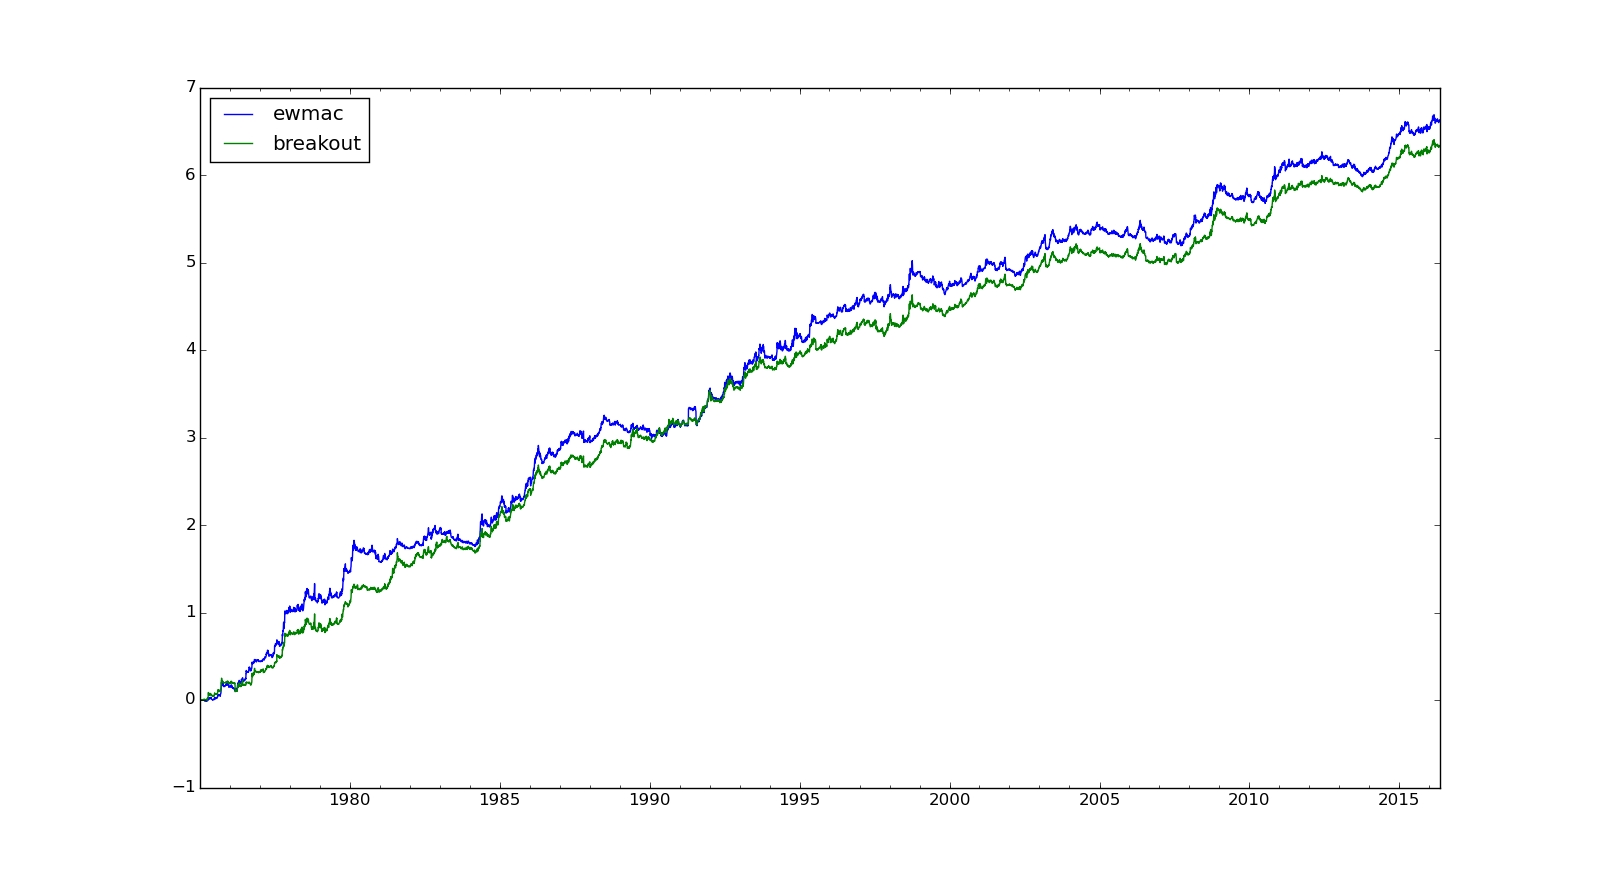
View attachment 164257
I basically use:
from systems.provided.futures_chapter15.basesystem import *
with my config.
I don't seem to be able to upload my YAML config, but the optimisation parameters are as follows:
'''
#
use_forecast_scale_estimates: True
#
forecast_scalar_estimate:
pool_instruments: True
#
# forecast combination
#
use_forecast_weight_estimates: True
#
forecast_weight_estimate:
method: bootstrap
frequency: W
pool_instruments: True
date_method: expanding
monte_runs: 100
cleaning: True
bootstrap_length: 50
ewma_span: 125
#
rule_variations: ['ewmac4_16', 'ewmac8_32', 'ewmac16_64','ewmac32_128', 'ewmac64_256', 'carry', 'breakout20', 'breakout40', 'breakout80', 'breakout160', 'breakout320']
#
#
forecast_correlation_estimate:
pool_instruments: True
#
use_instrument_weight_estimates: True
#
instrument_weight_estimate:
method: bootstrap
frequency: W
pool_instruments: True
date_method: expanding
monte_runs: 100
cleaning: True
bootstrap_length: 50
ewma_span: 125
'''
OK
I got 0.89 for the correlation which is higher than I expected (though perhaps not as high as you got). I used equal weights for the optimisation for speed, but I wouldn't expect much difference with more complex techniques.
Partly this might be because using the classic set of 5 instruments, for most of the time there aren't many instruments with data except for US10, CORN and EUROSTX, and these instruments happen to have more correlation between the breakout and ewmac rules. Anyway I'm running with all 37 instruments to see what that looks like.
Here's the code I ran (using the very latest version)
Code:
from syscore.accounting import account_test

from syscore.pdutils import turnover
from sysdata.configdata import Config

from systems.provided.futures_chapter15.estimatedsystem import futures_system
from systems.provided.moretradingrules.morerules import breakout

import pandas as pd
import numpy as np
from matplotlib.pyplot import show, legend, matshow

bvariations=["breakout"+str(ws) for ws in [10, 20, 40, 80, 160, 320]]
evariations=["ewmac%d_%d" % (fast, fast*4) for fast in [2,4,8,16,32, 64]]


my_config = Config("examples.breakout.breakoutfuturesestimateconfig.yaml")

## old system has ewmac only
my_config.rule_variations=evariations
my_config.forecast_weight_estimate["method"]="equal_weights"
system_old = futures_system(config=my_config, log_level="on")

## new system has breakouts
new_config = Config("examples.breakout.breakoutfuturesestimateconfig.yaml")
new_config.rule_variations=bvariations
new_config.forecast_weight_estimate["method"]="equal_weights"

system_new = futures_system(config=new_config, log_level="on")

curve1=system_old.accounts.portfolio()
curve2=system_new.accounts.portfolio()

print(curve1.stats())
print(curve2.stats())

print(account_test(curve2, curve1))


curves_to_plot=pd.concat([curve1.as_df(), curve2.as_df()], axis=1)
curves_to_plot.columns=["ewmac", "breakout"]

print(curves_to_plot.corr())
curves_to_plot.cumsum().plot()
show()
GAT
")