Based on a 10 year backtesting sample on a basket of futures markets with my proprietary fully automated intra day trading system.
The monthly stats for the system are as follows:

As you can see from the image, the 3 standard deviation monthly range is -25% to +35%.
In the back test the monthly range was actually -17% to +33%.
All the above figures are based on a 1% bet size per trade.
If I could not handle the small (but real if i trade long enough) probability of a 20% losing month I could reduce the bet size to say 0.5% per trade.
In the back test 31% of months lost money (shown as black in the bell curve)
And 69% of month were profitable (shown as white in the bell curve)
Live trading this system will commence later today.
The backtest for the system is already up 1.6% for October 2020, and 32% so far for 2020.
2020 is turning out to be a sub par year for this system. But this is normal, 50% of years are sub par!
And so are 50% of months. The hope is I don't get many >10% losing months in a row!
The Sharpe Ratio for this system is around 1.7.
That might seem a bit high, but the system has limits on the number of contracts it can handle per trade.
It is going to struggle to scale to make 60% per year on $5 million for example.
I will update this journal at the end of each month. With monthly % PnL for the month based on live trading with a 1% bet size.
PS. I am not going to disclose any further information about this system (eg which markets it trades or how many signals it generates per day), sorry but I don't need any more competition.
The monthly stats for the system are as follows:
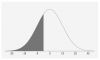
- The monthly mean return is 5%.
- The monthly standard deviation is 10%.
As you can see from the image, the 3 standard deviation monthly range is -25% to +35%.
In the back test the monthly range was actually -17% to +33%.
All the above figures are based on a 1% bet size per trade.
If I could not handle the small (but real if i trade long enough) probability of a 20% losing month I could reduce the bet size to say 0.5% per trade.
In the back test 31% of months lost money (shown as black in the bell curve)
And 69% of month were profitable (shown as white in the bell curve)
Live trading this system will commence later today.
The backtest for the system is already up 1.6% for October 2020, and 32% so far for 2020.
2020 is turning out to be a sub par year for this system. But this is normal, 50% of years are sub par!
And so are 50% of months. The hope is I don't get many >10% losing months in a row!
The Sharpe Ratio for this system is around 1.7.
That might seem a bit high, but the system has limits on the number of contracts it can handle per trade.
It is going to struggle to scale to make 60% per year on $5 million for example.
I will update this journal at the end of each month. With monthly % PnL for the month based on live trading with a 1% bet size.
PS. I am not going to disclose any further information about this system (eg which markets it trades or how many signals it generates per day), sorry but I don't need any more competition.
Attachments
Last edited:
")